- The token’s price declined by over 3% in the last seven days.
- A few metrics looked bullish, but market indicators suggested otherwise.
XRP bears dominated the market last week as its price dropped during that period. Things could get worse for the token as a bearish pattern emerged on the token’s price chart.
A bearish breakout could result in a substantial loss in the token’s market capitalization over the coming days.
XRP bears getting ready
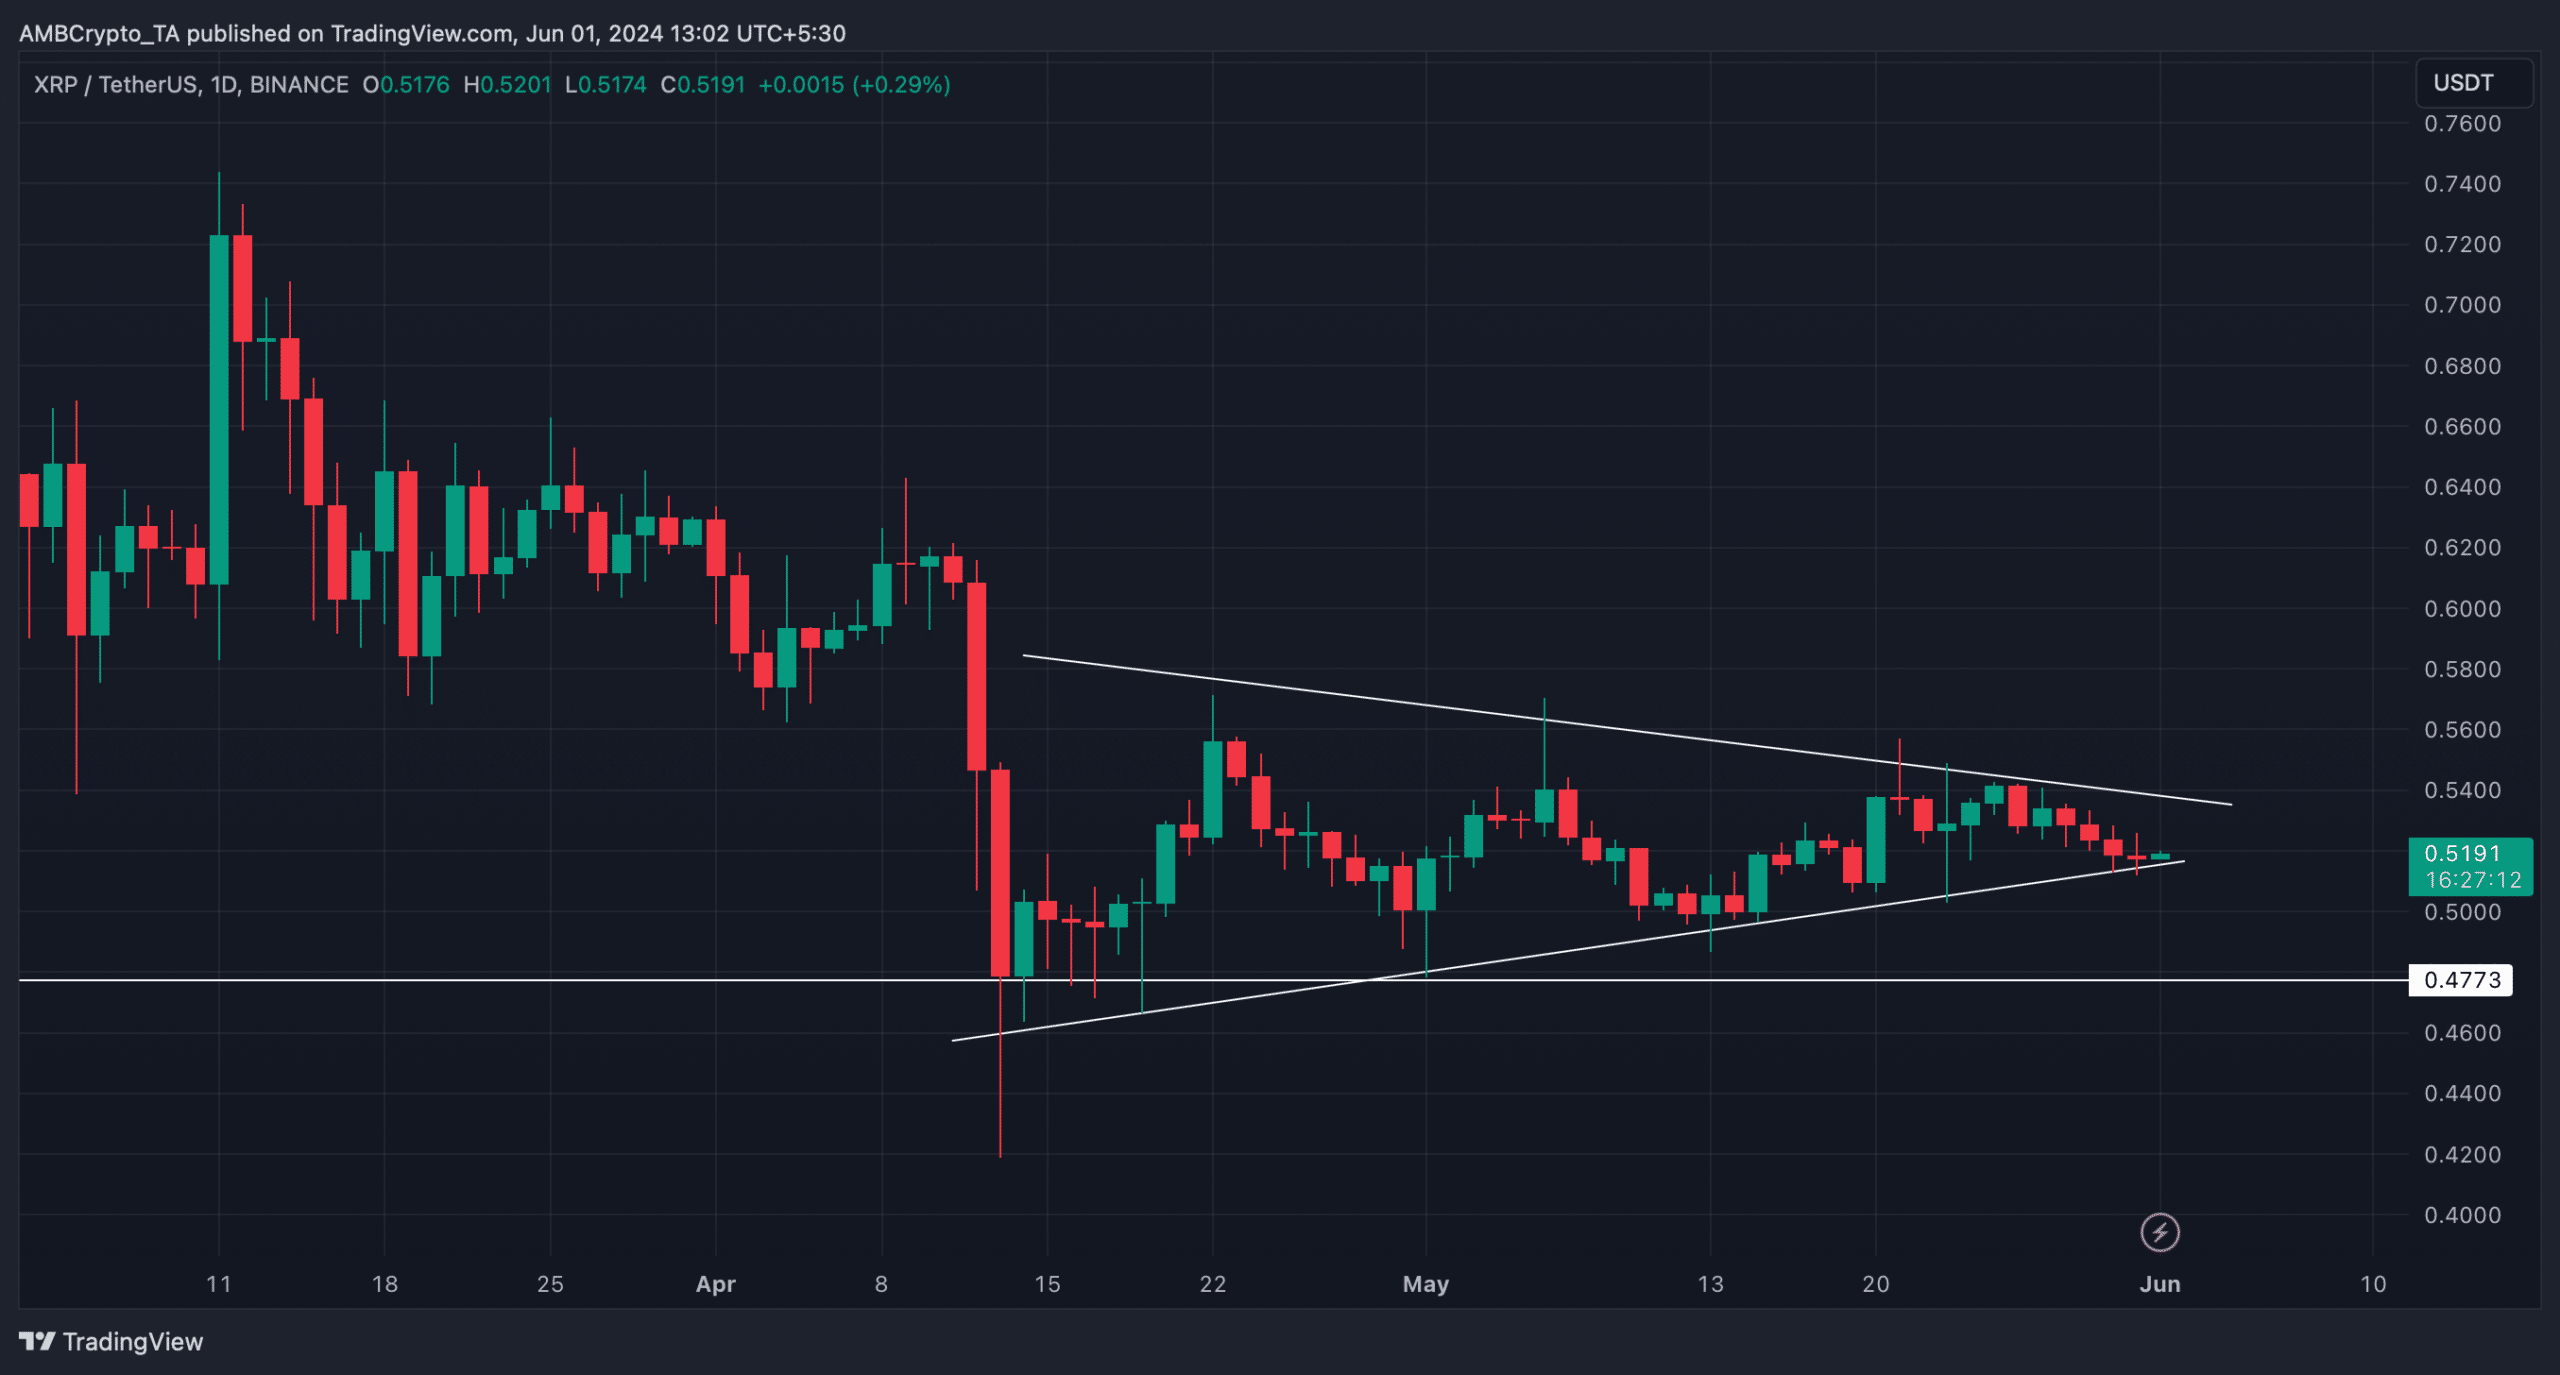
CoinMarketCap’s data revealed that XRP witnessed a more than 3% price decline over the last seven days. At the time of writing, the token was trading at $0.519 with a market capitalization of over $28.7 billion, making it the seventh largest crypto.
Meanwhile, AMBCrypto’s analysis of the token’s price chart revealed a bearish pennant pattern.
The token’s price entered this pattern in mid-April and since then has consolidated inside the pattern. At press time, the token’s price was testing the lower limit of the pattern.
If bears keep control, then a southward breakout might happen soon. If that turns out to be true, then investors might witness the token’s price drop to $0.477.
Is a price decline inevitable?
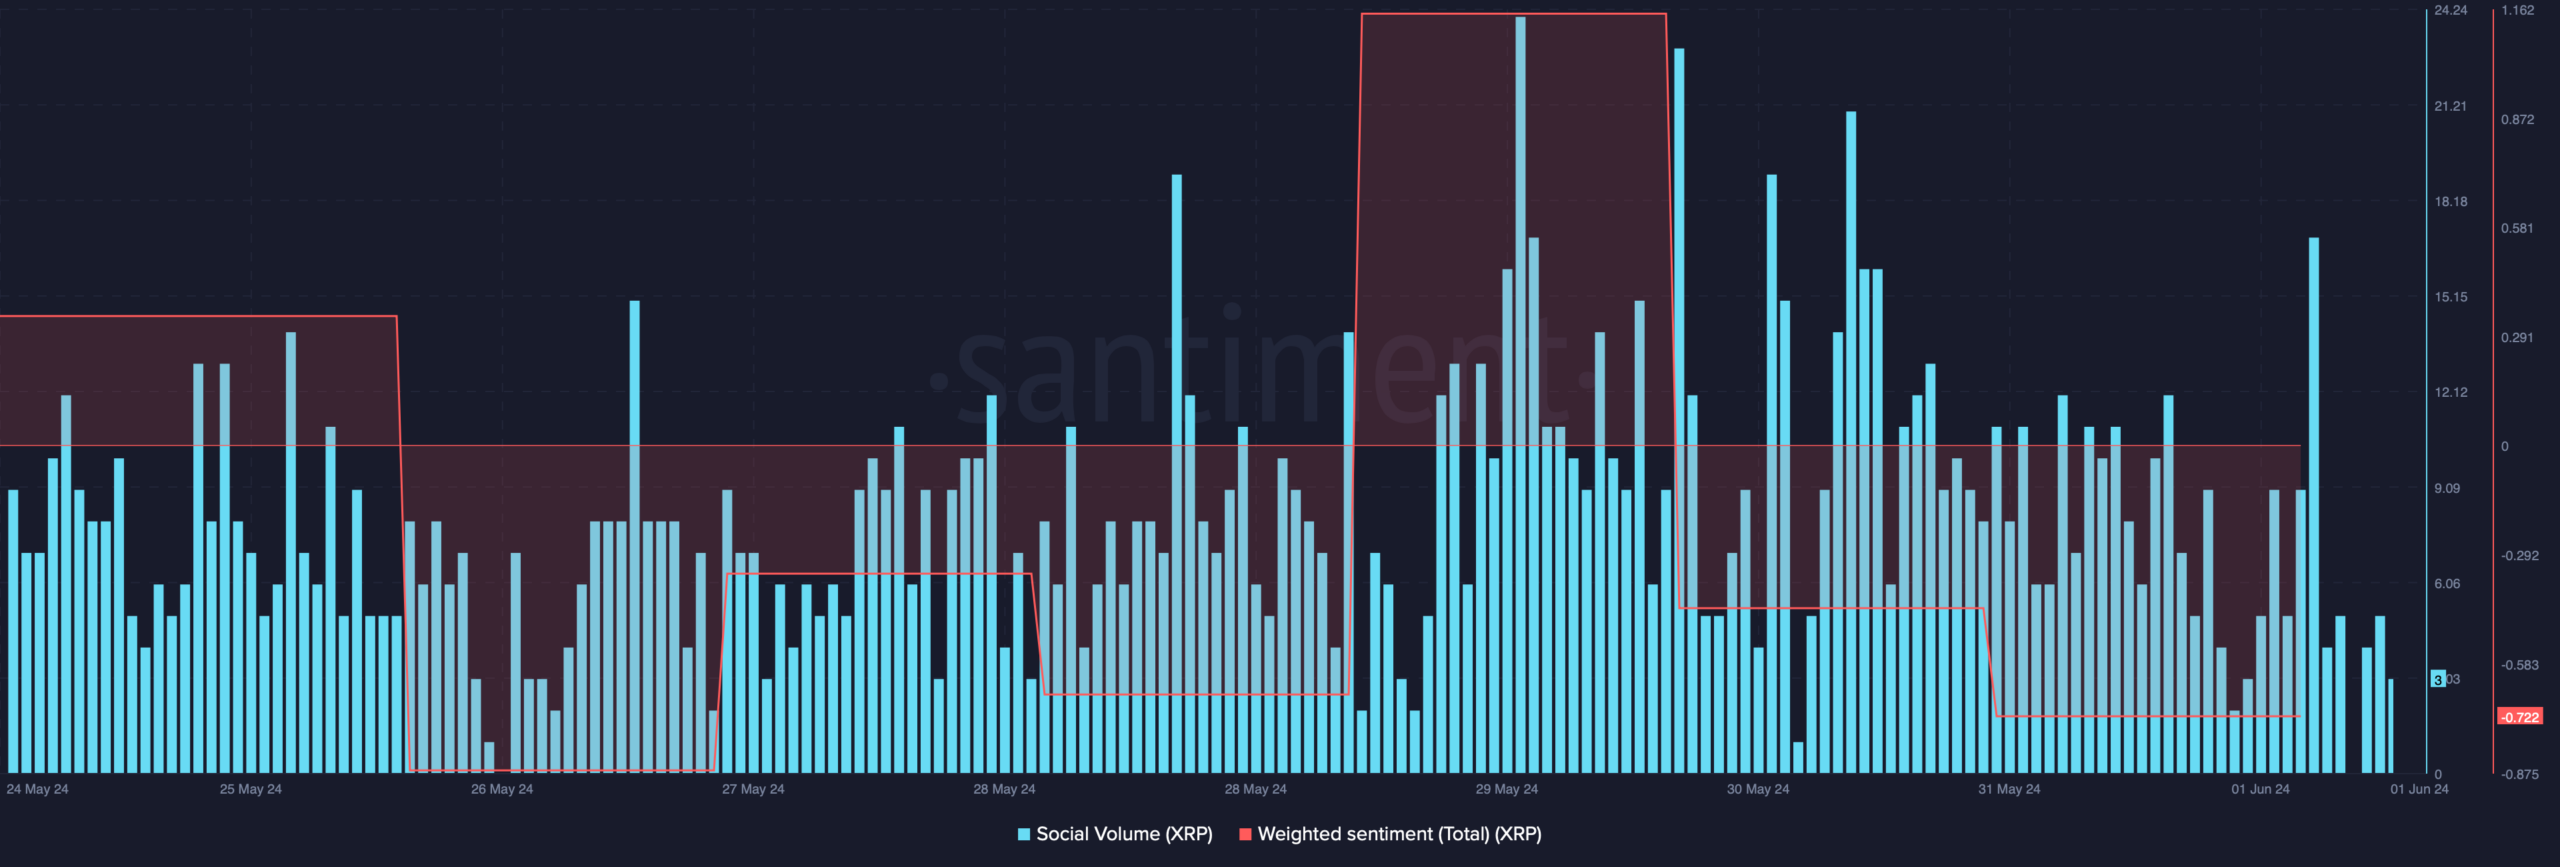
To understand whether the possibility of a price decline was likely, AMBCrypto analyzed the token’s on-chain metrics. As per our analysis of Santiment’s data, XRP’s social volume remained high, reflecting its popularity in the crypto space.
However, its weighted sentiment remained in the negative zone, which meant that bearish sentiment was dominant in the market.
On top of that, Coinglass’ data revealed that XRP’s long/short ratio registered a decline in the 4-hour timeframe. A low ratio suggests bearish sentiment, further hinting at a price decline.
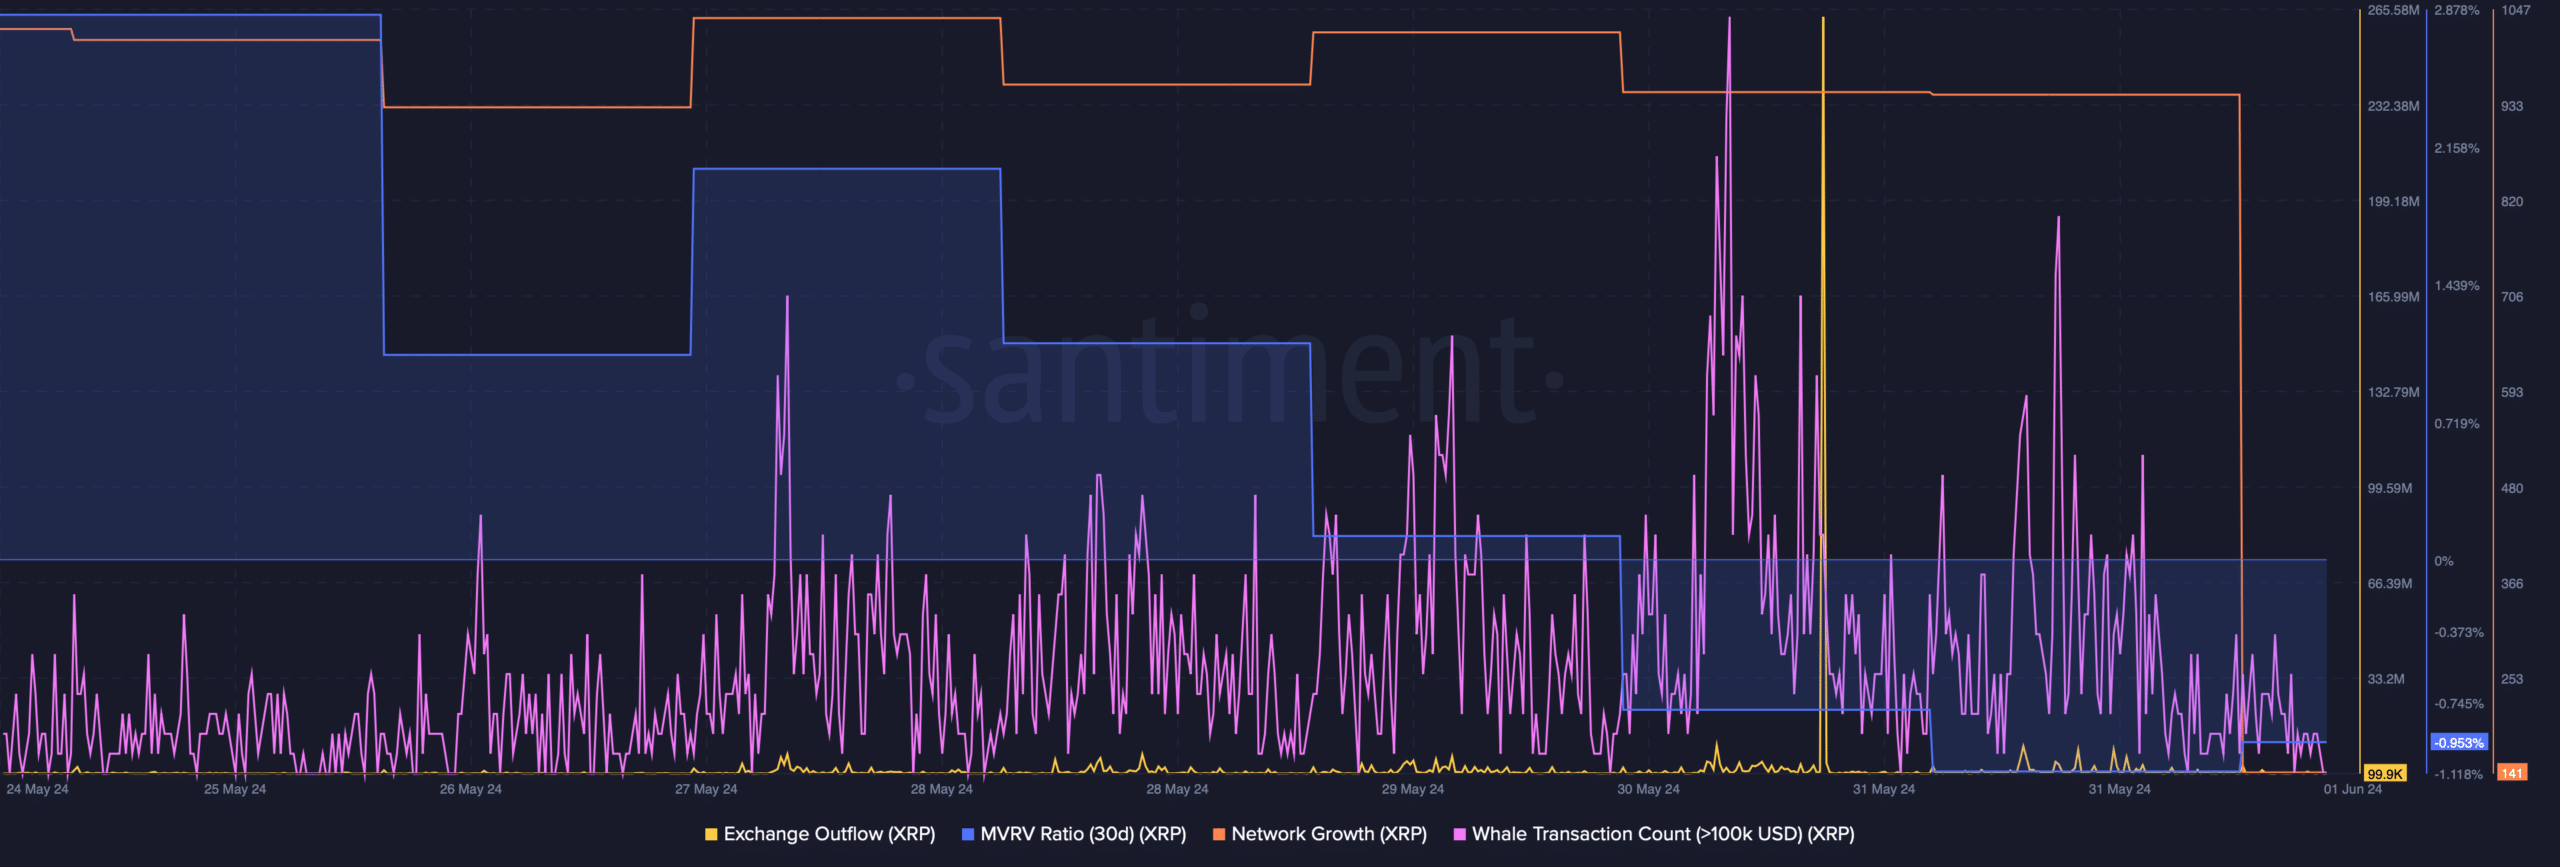
Additionally, its MVRV ratio dropped sharply, which can be inferred as a bearish signal.
Nonetheless, the rest of the metrics supported the bulls. For example, XRP’s exchange outflow spiked last week. The token’s number of whale transactions was relatively high, suggesting that whales were actively trading the token.
More addresses were created to transfer the token, which was evident from its high network growth.
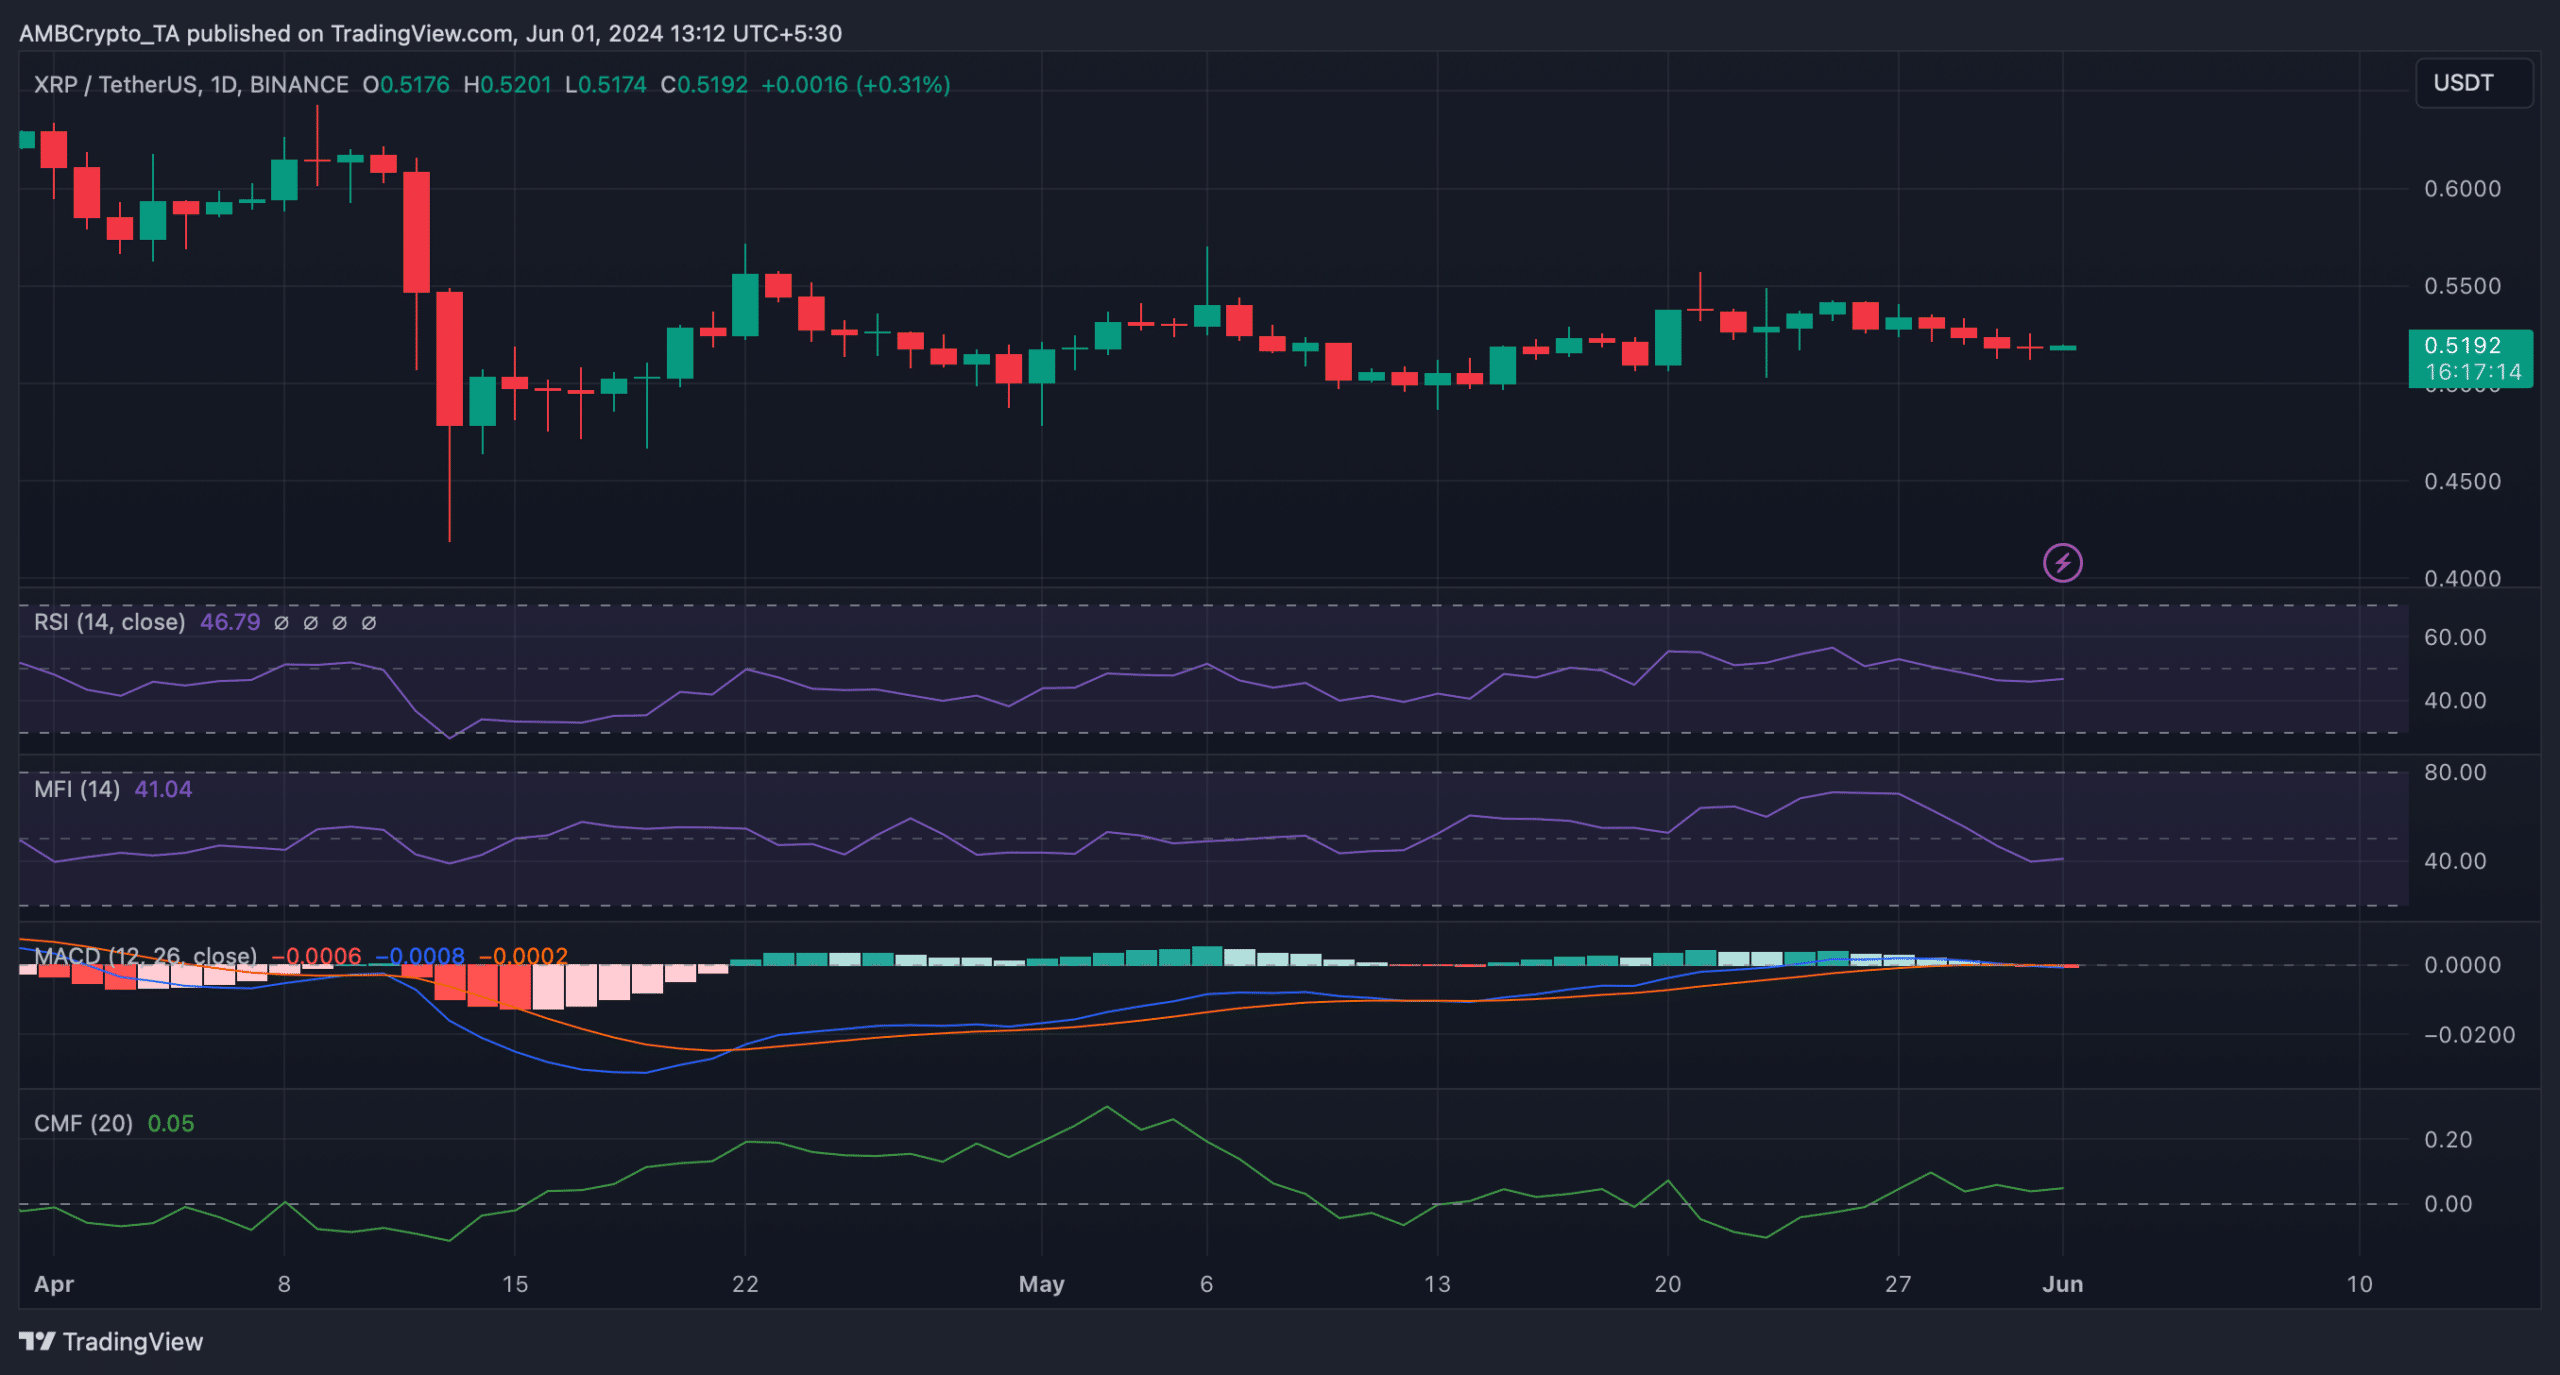
We then analyzed its daily chart to better understand which way the token’s price was headed. We found that the MACD displayed a bearish crossover. At press time, the Relative Strength Index (RSI) had a value of 46.74, meaning that it was bearish.
Realistic or not, here’s XRP’s market cap in BTC’s terms
On top of that, the token’s Money Flow Index (MFI) also registered a downtick and was resting under the neutral mark. These market indicators suggested that the possibility of a bearish breakout was high.
However, the Chaikin Money Flow (CMF) remained somewhat bullish as it was still above the neutral mark.


