- LISTA’s value has fallen by 30% in the last 24 hours
- Key technical indicators hinted at the possibility of a further decline in its value
LISTA, the native token of Lista DAO, an open-source, decentralized stablecoin lending protocol, has declined by almost 30% in the last 24 hours.
This comes a day after the altcoin climbed to an all-time high of $0.84 on 21 June. This surge happened when leading cryptocurrency exchange Binance announced LISTA’s integration across some of its trading platforms, including Binance Simple Earn, Buy Crypto, Convert, Margin, and Futures.
This fueled a 13% spike in the token’s value. However, exchanging hands at $0.57 at press time, LISTA’s value has since declined by 32%, according to CoinMarketCap.
LISTA is under significant selling pressure
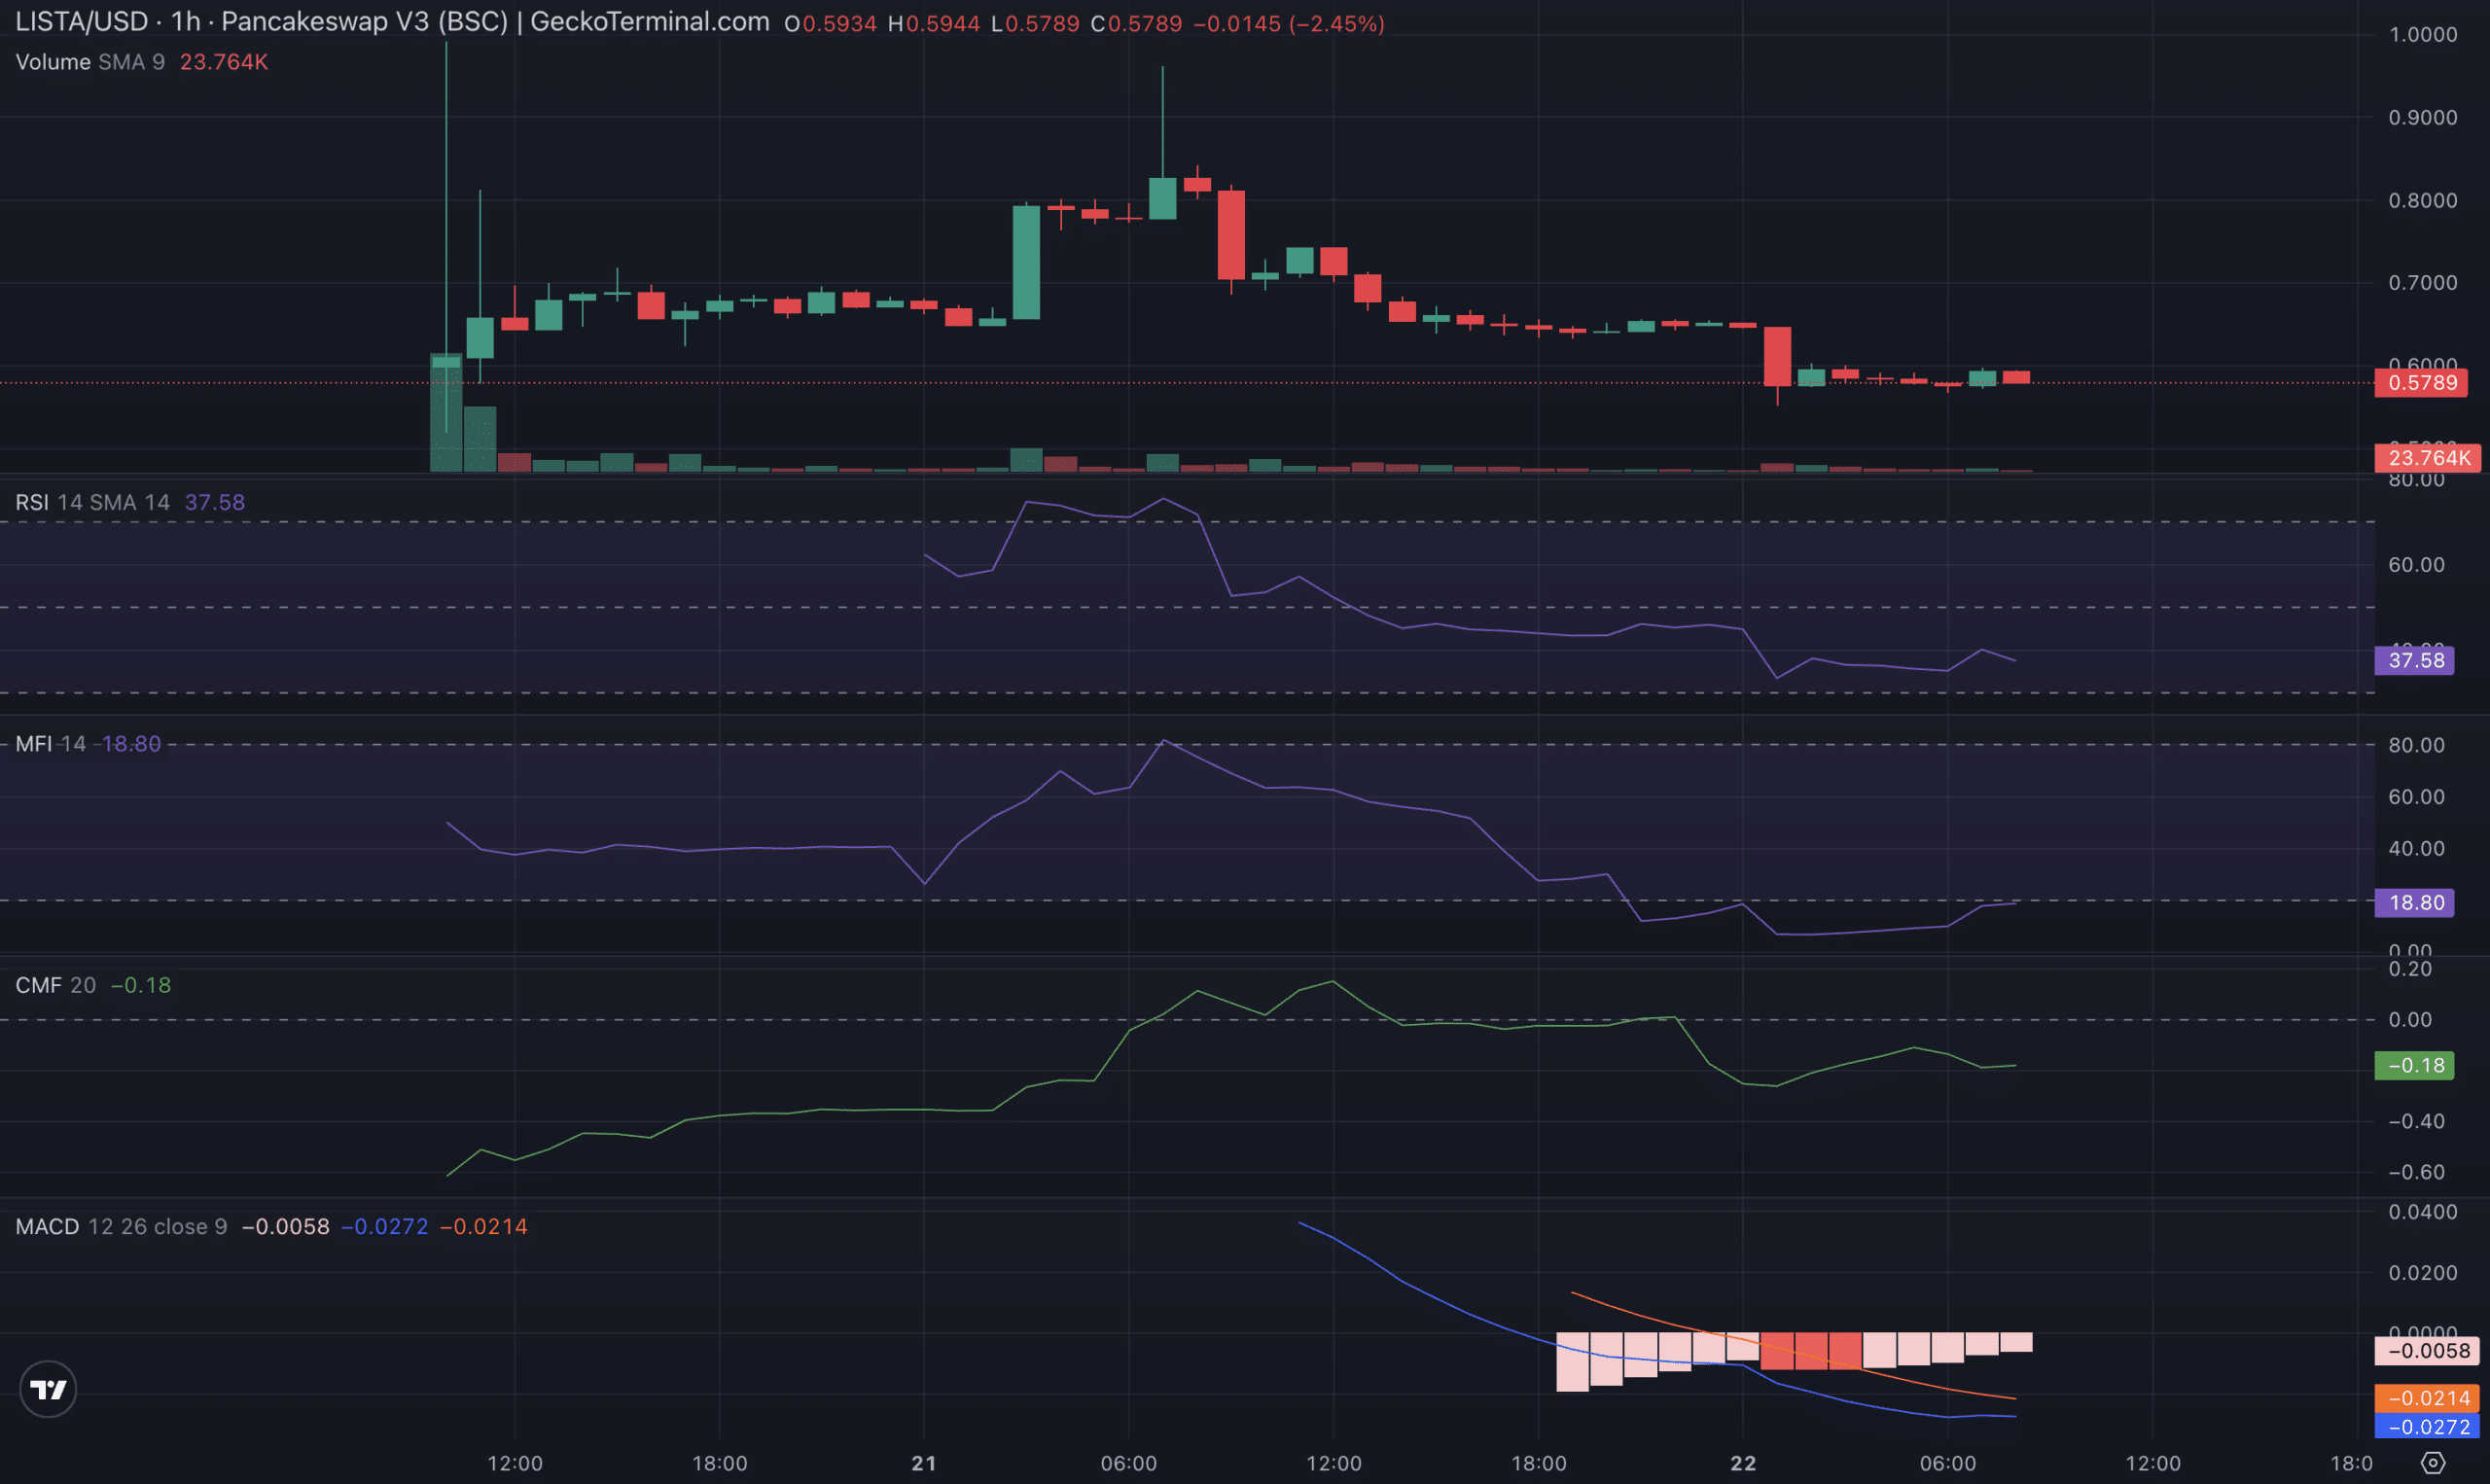
LISTA’s price performance, assessed on the hourly chart, revealed a significant decline in demand for the altcoin. Its key momentum indicators were spotted below their respective center lines at press time.
For example, the token’s Relative Strength Index (RSI) was 35.24, while its Money Flow Index (MFI) was 9.94.
These indicators measure an asset’s overbought and oversold conditions. Their values range between 0 and 100, with readings above 70 indicating that the asset is overbought and likely due for a correction. In contrast, readings below 30 mean that the asset is oversold and may record a rebound.
At their values at press time, LISTA’s RSI and MFI confirmed the preference for token distribution. They suggested that selling pressure outweighed buying activity.
Furthermore, the token’s Chaikin Money Flow (CMF) was -0.22 at press time. This indicator measures money flow into and out of an asset’s market.
A CMF value below zero is a sign of market weakness. It is a bearish signal, one which suggests that market participants are removing their capital from the market. When an asset’s price declines and its CMF value falls below zero, traders often interpret this as a signal that the price decline will continue.
Readings from LISTA’s moving average convergence divergence (MACD) indicator confirmed the bearish bias towards it. The MACD line (blue) rested below its signal (orange) and zero lines at press time.
This indicator is used to identify potential buy and sell signals. When set up this way, it is considered a bearish signal, indicating that it may be a good time to sell.


