- Notcoin’s price increased by more than 14% in the last 24 hours.
- Derivatives market metrics hinted at a price correction.
Notcoin [NOT] bulls clearly dominated the market last week as the recently launched token’s price increased by double digits.
This just might be the tip of the iceberg, as the regular uptrend hinted at a massive bull rally in the coming weeks or months. Let’s see what’s going on.
Notcoin is pumping
CoinMarketCap’s data revealed that Notcoin’s price had dropped to last week’s lowest of $0.0093 on the 5th of July. However, since then, the token has gained bullish momentum.
In the last seven days, NOT’s price increased by more than 14%. In fact, in the last 24 hours alone, NOT’s value surged by over 4%.
At the time of writing, NOT was trading at $0.01596 with a market capitalization of over $1.63 billion.
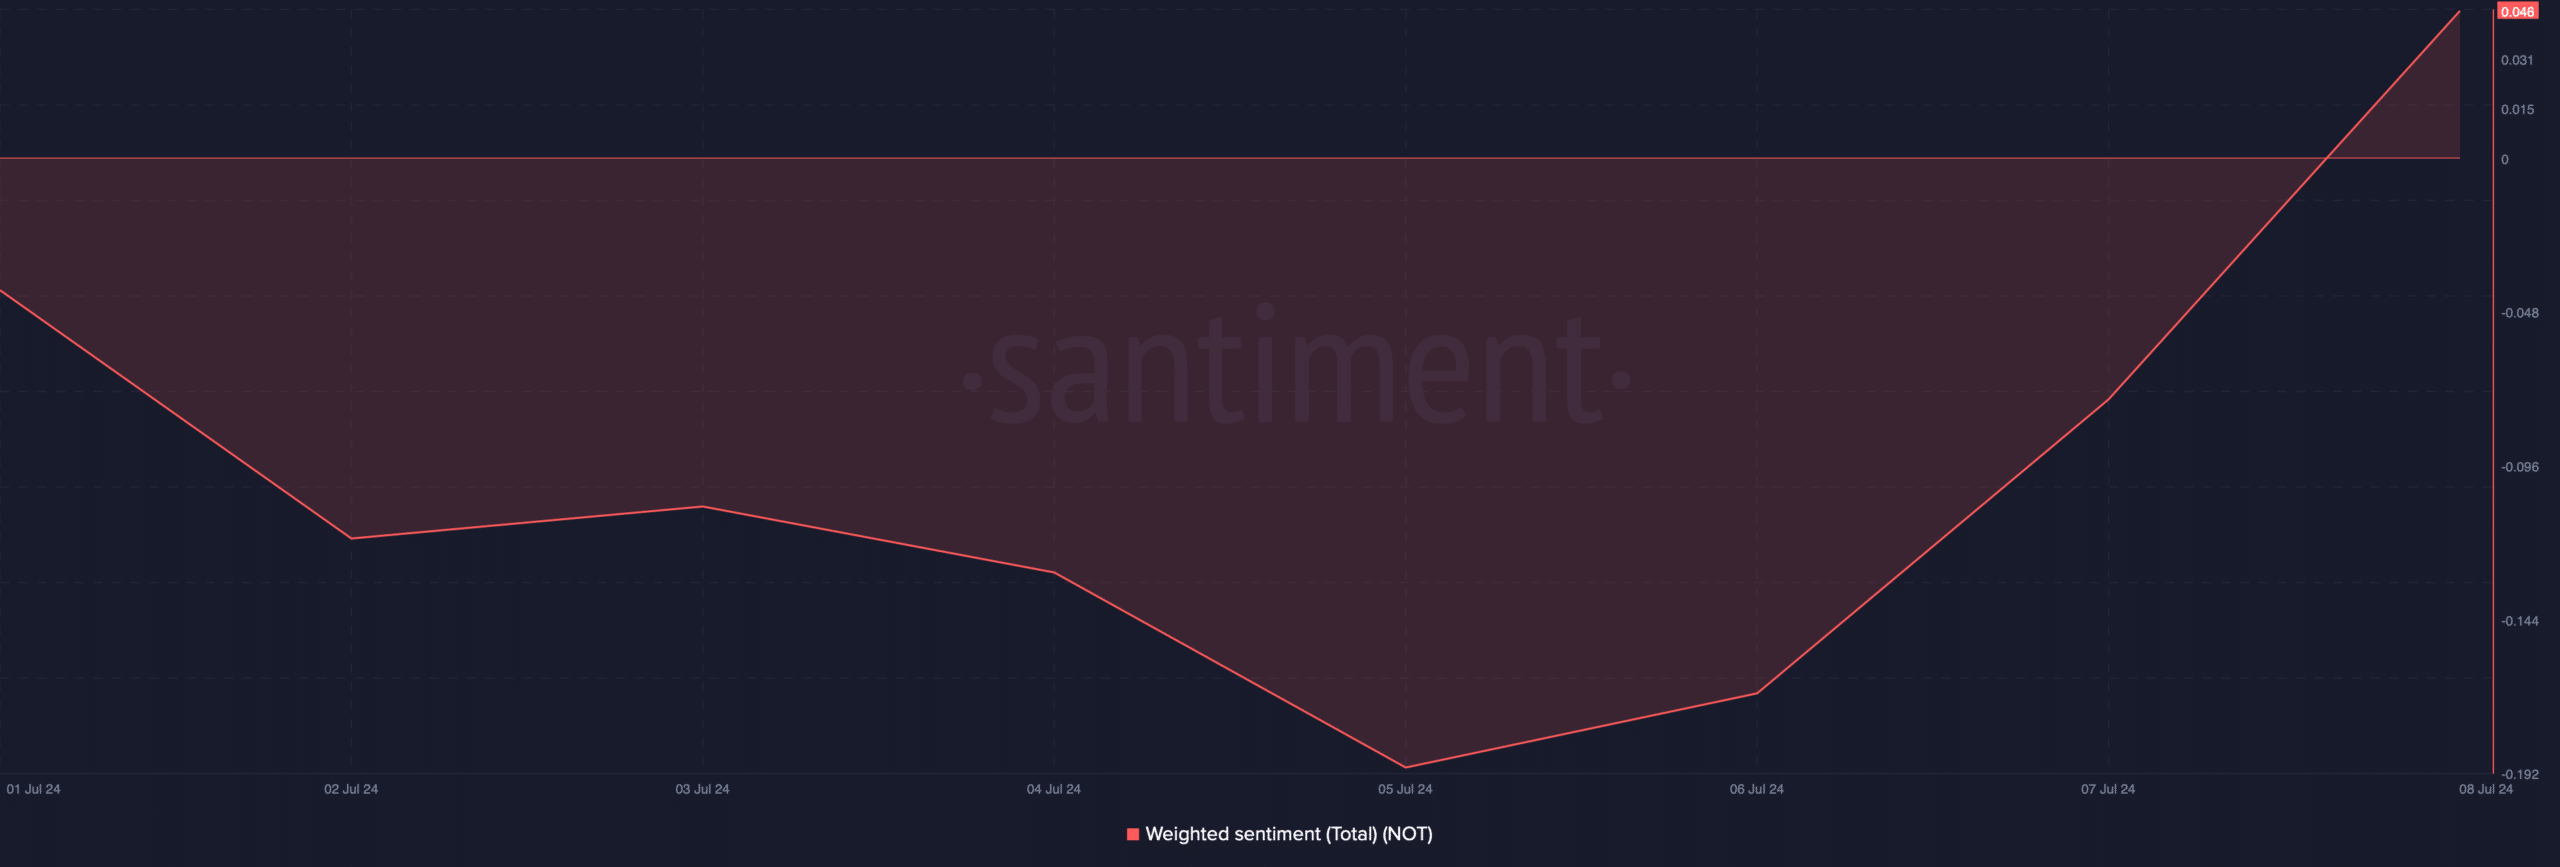
AMBCrypto’s look at Santiment’s data revealed that the bullish price action had a positive impact on the token’s social metrics, as its Weighted Sentiment improved.
This meant that bullish sentiment around the token was high.
Meanwhile, World Of Charts, a popular crypto analyst, recently posted a tweet highlighting the fact that NOT has successfully broken above a descending channel pattern.
The token has been consolidating inside the pattern since June, after reaching an all-time high. If the pattern is to be believed, then investors might witness NOT surging by 80%–90% in the coming months.
NOT’s upcoming targets
Since the aforementioned breakout looked bullish, AMBCrypto planned to delve deeper into NOT’s stats to see whether they also support a price rise.
Our analysis of Glassnode’s data revealed that Notcoin’s long/short ratio decreased.
A drop in the ratio means that there are more short positions in the market than long positions, meaning that bearish sentiment was dominant in the market.
Additionally, NOT’s Funding Rate also increased. Generally, prices tend to move in a different direction than the Funding Rate, suggesting a price drop in the coming days.
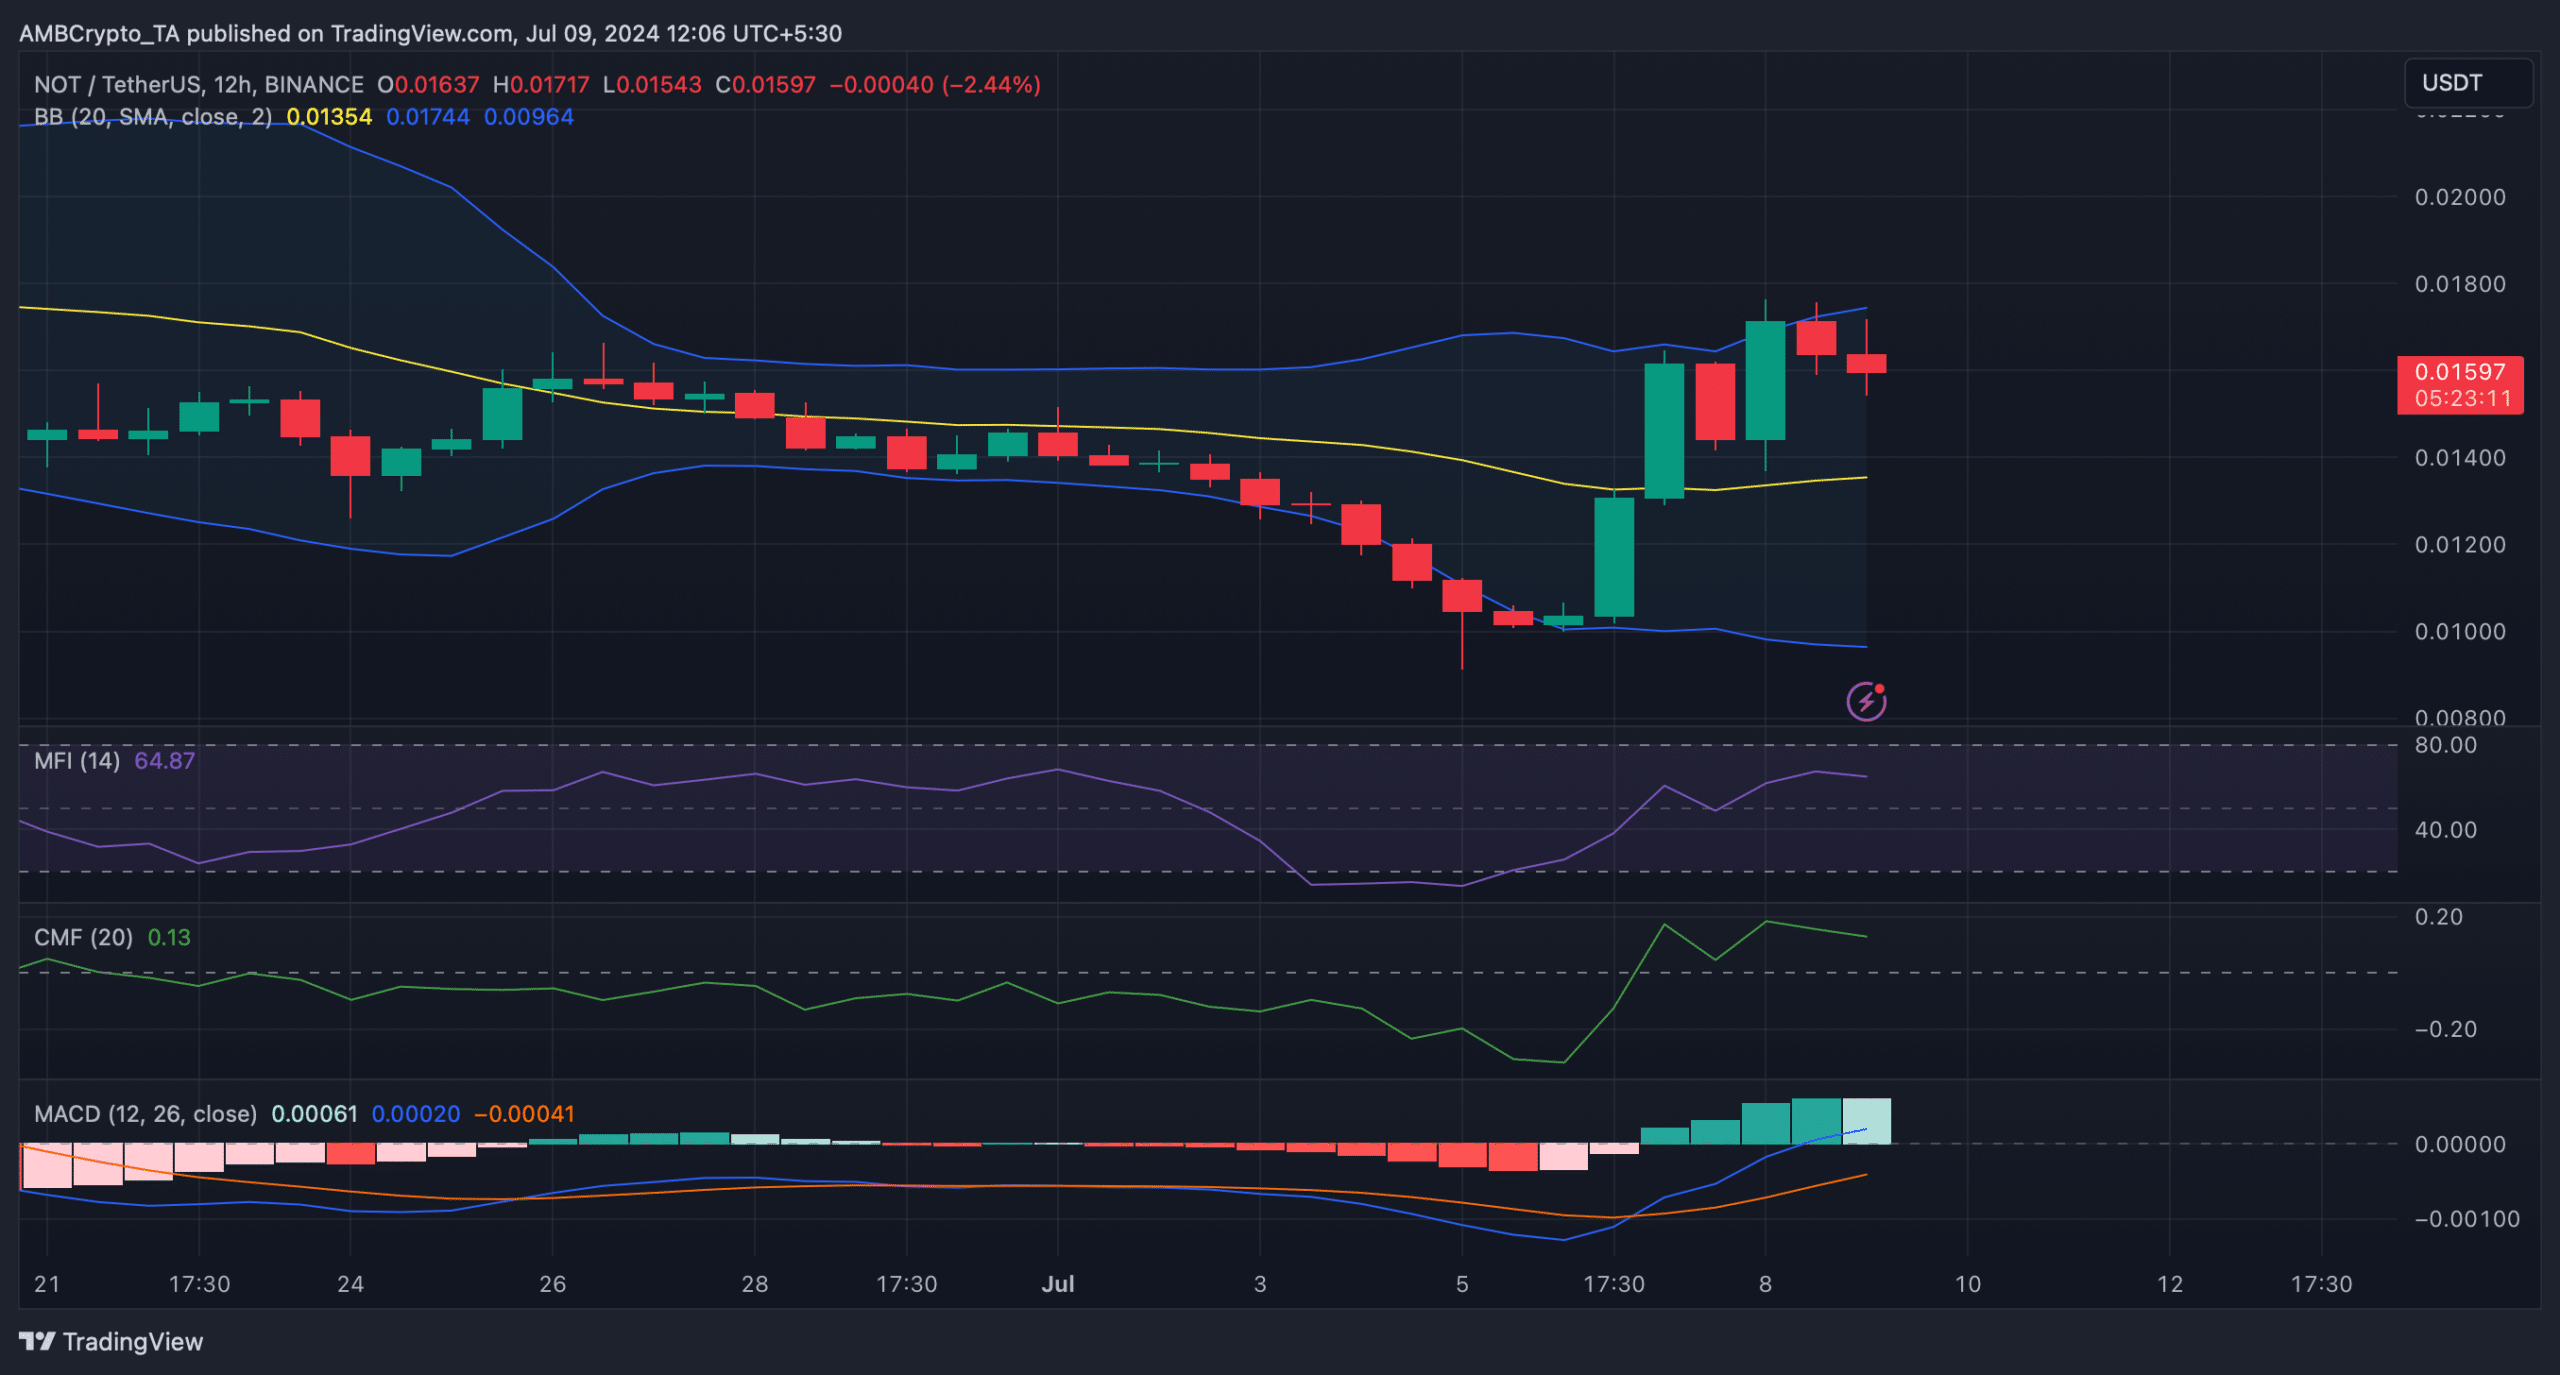
We then checked the token’s daily chart, which showed that the Relative Strength Index (RSI) and Chaikin Money Flow (CMF) both registered downticks.
The Bollinger Bands revealed that NOT’s price has touched the upper limit of the indicator. Usually, this results in a price correction.
Realistic or not, here’s NOT’s market cap in TON’s terms
Nonetheless, the technical indicator MACD supported the buyers as it displayed a clear bullish advantage in the market.
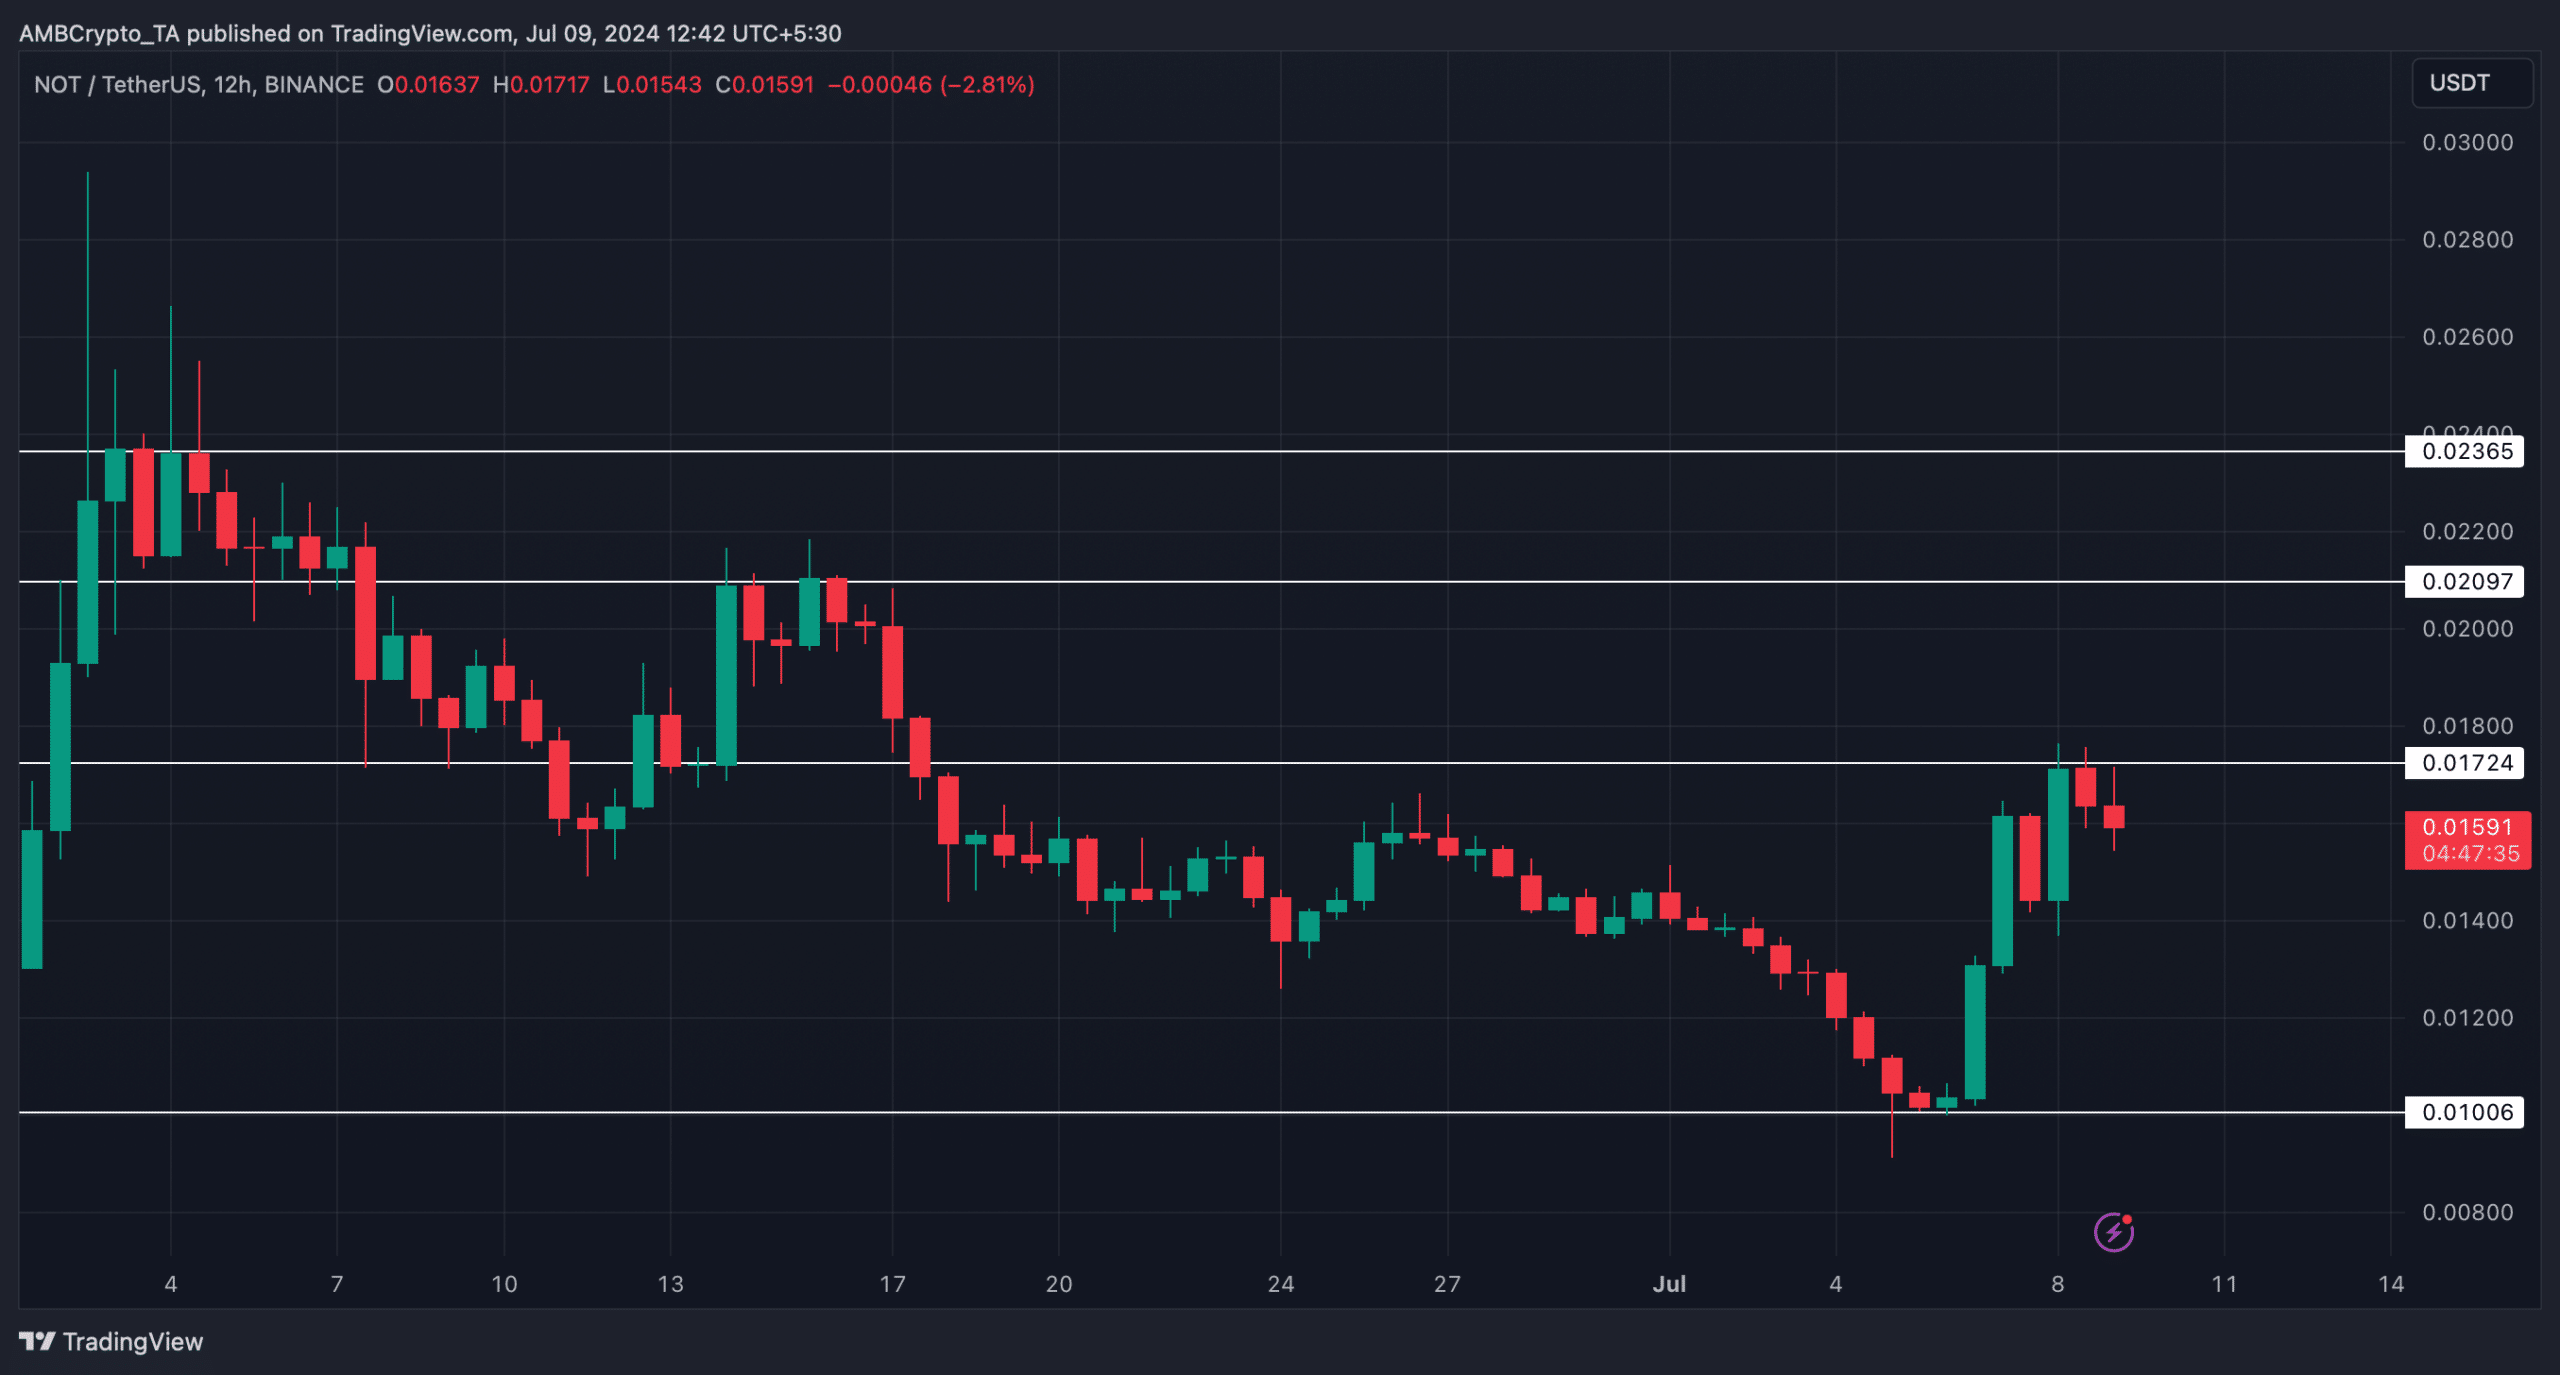
In order for Notcoin to sustain its bull rally, it is important for it to break above $0.0172. A successful jump above that level would allow it to touch $0.02 before retesting its ATH.


