

The gap between rents in the north and south has narrowed to the closest point in over a decade, according to Hamptons.
Last month, the average rent in the South of England cost 37% or £357 per calendar month (pcm) more than in the North of England, the lowest figure since our records began in 2013. This gap has closed from 43% in August 2023 and a peak of 55% in November 2021.
In the South of England, rental growth has cooled from 8.7% to 5.0% over the last year. Meanwhile in the North of England, rents are still rising 9.6% year-on-year, a similar pace to last year.
Rental growth on newly let homes across Great Britain decelerated to 5.0% in August, marking the slowest rate since August 2021 and less than half the peak of 12.0% recorded in August 2023.
Over the last five years, rents have risen 34% or by £349 pcm across Great Britain (chart 3). However, after adjusting for inflation, rents have only increased 10% since 2019. Rents in Wales (-5%) have fallen in real terms.
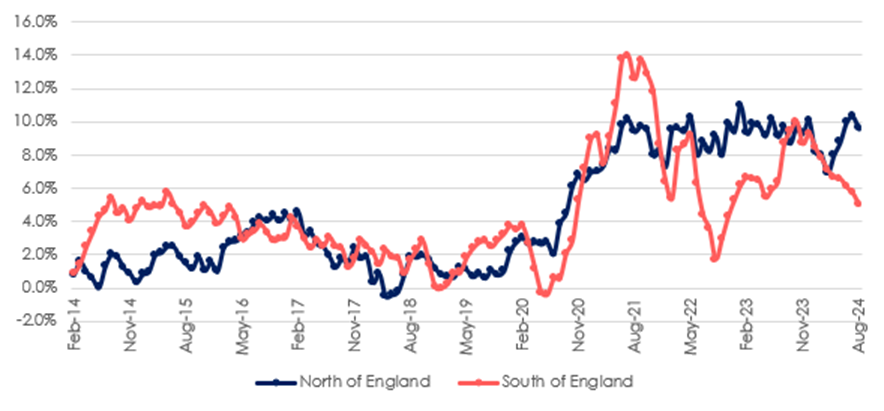
Chart 1 – Year-on-year rental growth for newly let properties
Source: Hamptons
Rental growth across Great Britain has been cooling for the last 12 months. It was August last year when rental growth for newly let properties peaked at 12.0%, five times higher than the pre-Covid average (2015-19) of 2.5%. Last month, rental growth across the country stood at 5.0%, the lowest rate since April 2021.
However, these figures mask a regional divide. In the South of England the rate of growth has fallen from 8.7% to 5.0% over the last year, while in the North of England rents are still rising 9.6% year-on-year, around the same pace as last year (9.7%) (chart 1).
Consequently, the gap between rents in the North and South of England has closed to its smallest level since our records began in 2013. Last month, the average new tenancy in the South of England cost £1,318pcm, 37% more than in the North of England where rents averaged £960pcm. This gap has narrowed from 43% in August 2023 and down from a peak of 55% in November 2021.
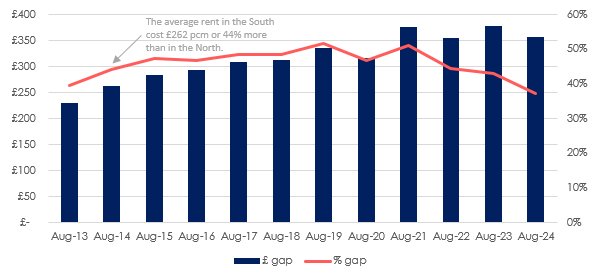
Chart 2 – Gap between rents in the South and North of England (new lets)
Source: Hamptons
The gap has also fallen in cash terms over the last year with rental growth in the North of England running at nearly twice the pace of homes in the South. Last month, the average rental home in the South cost £357 pcm more than one in the North, down from £378 pcm in August 2023.
Tenants moving home in the North East faced the biggest rent hikes across Great Britain. Last month rents in the North East rose 12.1% year-on-year, marking the third consecutive month of double-digit increases. Meanwhile, Londoners saw the smallest rent rises in percentage terms, with rents up 2.1% year-on-year compared to the 17.1% recorded in August 2023.
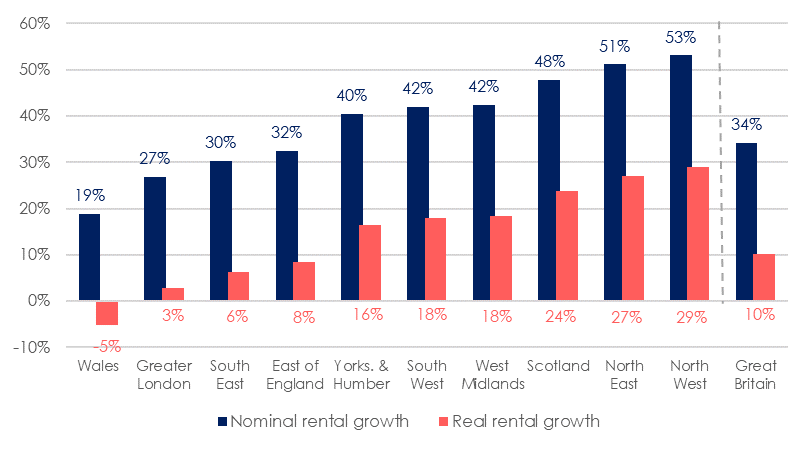
Chart 3 – Nominal versus real rental growth since August 2019
Source: ONS & Hamptons
The North-South divide has been gradually closing over the last five years. Across Great Britain, average rents have risen 34% or by £349 pcm over the last five years, costing the typical tenant an extra £4,184 each year. Rents in the North of England are up 48%, outpacing the 34% growth recorded in the South. This predominantly reflects the house price cycle, with prices in the North catching up with the South over the last seven years.
However, after adjusting for inflation, in real terms rents have only risen 10% across the country since 2019, equating to an average of 2% each year. In real terms, rents in the North of England have increased by 24%, compared to 10% across the South of England. Rents in Wales (-5%) have fallen in real terms over the 5-year period. Meanwhile, Greater London rents only just sit in positive territory, having seen 3% real rental growth since 2019. This equates to an average of just 0.2% real rental growth each year in the capital.
The North West tops the rental growth league. Here, average rents on newly let properties have increased by 53% since 2019, more than double the growth recorded in Wales (19%), the weakest performing region. They’ve also increased in real terms, up 29% in the North West over the last five years.
Aneisha Beveridge, head of research at Hamptons, said: “Much like house prices, the rental north-south divide has been closing for the last five years. The narrowing reflects the cyclical nature of the housing market with house prices in the North of England rising 31%, nearly double the Southern rate. These figures have been mirrored in the rental market, with rents in the North of England quickly playing catch up.
“But it’s only been in the last year that the gap has really started to narrow beyond the point we’ve previously seen. This has been driven by the slowing of rental growth across Southern England caused by greater affordability pressures. While tenants in the South have seen weaker growth in percentage terms, in cash terms, they’ve faced big rises. A 10% increase in South of England rents would cost tenants an extra £1,581 a year, £428 more than for a tenant in the North.
“Despite the pace of rental growth slowing, it’s remained resolutely in positive territory, triggered by landlord’s higher costs. Nearly half of the average monthly rent a landlord receives now goes towards costs. At the same time, investors are starting to think about the upcoming Budget. While recent Budgets have mostly left investors alone, landlords will be watching October’s announcement more closely than usual to get a steer on what they can expect from a Labour government.”
Table 1 – Rental growth on newly let properties in August 2024
| Average Rent PCM | YoY % | YoY £ | |
| Greater London | £ 2,381 | 2.1% | £ 49 |
| Inner London | £ 3,318 | 7.9% | £ 242 |
| Outer London | £ 2,203 | 0.5% | £ 12 |
| East of England | £ 1,302 | 5.5% | £ 68 |
| South East | £ 1,414 | 5.8% | £ 77 |
| South West | £ 1,186 | 3.2% | £ 37 |
| Midlands | £ 988 | 7.2% | £ 66 |
| North | £ 960 | 9.6% | £ 84 |
| Wales | £ 802 | 2.1% | £ 17 |
| Scotland | £ 983 | 5.2% | £ 48 |
| Great Britain | £ 1,369 | 5.0% | £ 65 |
| Great Britain (Excluding London) | £ 1,109 | 6.5% | £ 69 |
Source: Hamptons