- Bitcoin’s recent on-chain metrics indicated a potential market top, with a cycle peak similar to previous years.
- Analysts observed increased selling activity, aligning with historical trends.
Bitcoin [BTC] was experiencing a downturn at press time, reversing its earlier rally above $63,000.
Over the past week, the cryptocurrency has now seen a 1.1% drop, with a more significant 2.7% decline in the last 24 hours alone, bringing its trading price down to $60,929.
Amid these market movements, Charles Edwards, the founder of Capriole Investments, has indicated that various on-chain metrics suggest a potential weakening in Bitcoin’s market strength.
Bitcoin’s turning point?
Charles Edwards pointed to various on-chain indicators as potentials of market exhaustion. One significant sign is the behavior of Bitcoin’s Long-Term Holder (LTH) inflation rate, which Glassnode monitors.
The LTH inflation rate, which measures the annualized rate at which long-term holders are selling their Bitcoin relative to new coins mined, has seen a sustained increase over the past two years.
Currently, it hovers near a critical mark historically associated with market tops. Edwards noted that the LTH market inflation rate nearing the 2.0 nominal inflation rate often signals a cycle peak.
At press time, the king coin was dangerously close at 1.9.
Another pivotal metric discussed by Edwards was the Dormancy Flow, which evaluated the value of spent coins relative to their age and the overall transaction volume.
Recent data has shown a sharp rise in the Dormancy Z-score, particularly in April 2024, which could imply that older coins are moving at a rate suggestive of a cycle top.
Edwards elaborated,
“Peaks in this metric (z-score) typically see cycle tops just three months later. Well, it’s now three months later. The price has only gone down, and the Dormancy Z-Score peak remains with a structure very comparable to the 2017 and 2021 tops.”
The Dormancy Flow Z-score, at press time, suggested that Bitcoin’s price might be peaking for this cycle, as it appeared overvalued based on transaction volumes of older coins, potentially indicating a broader market downturn.
Furthermore, spikes in Bitcoin’s Spent Volume, particularly from coins 7–10 years old, often signal the top of a cycle due to increasing market risk.
Edwards noted a significant increase in Spent Volume in 2024, describing the movement of an unprecedented amount of Bitcoin on-chain as extraordinary.
He also mentioned that over $9 billion worth of Bitcoin from dormant accounts over ten years old has been mobilized, primarily associated with the settlement activities of the defunct Mt. Gox exchange.
Cycle top in: Are traders aware?
While Charles Edwards highlighted potential weaknesses in Bitcoin’s price, it is prudent to examine other perspectives.
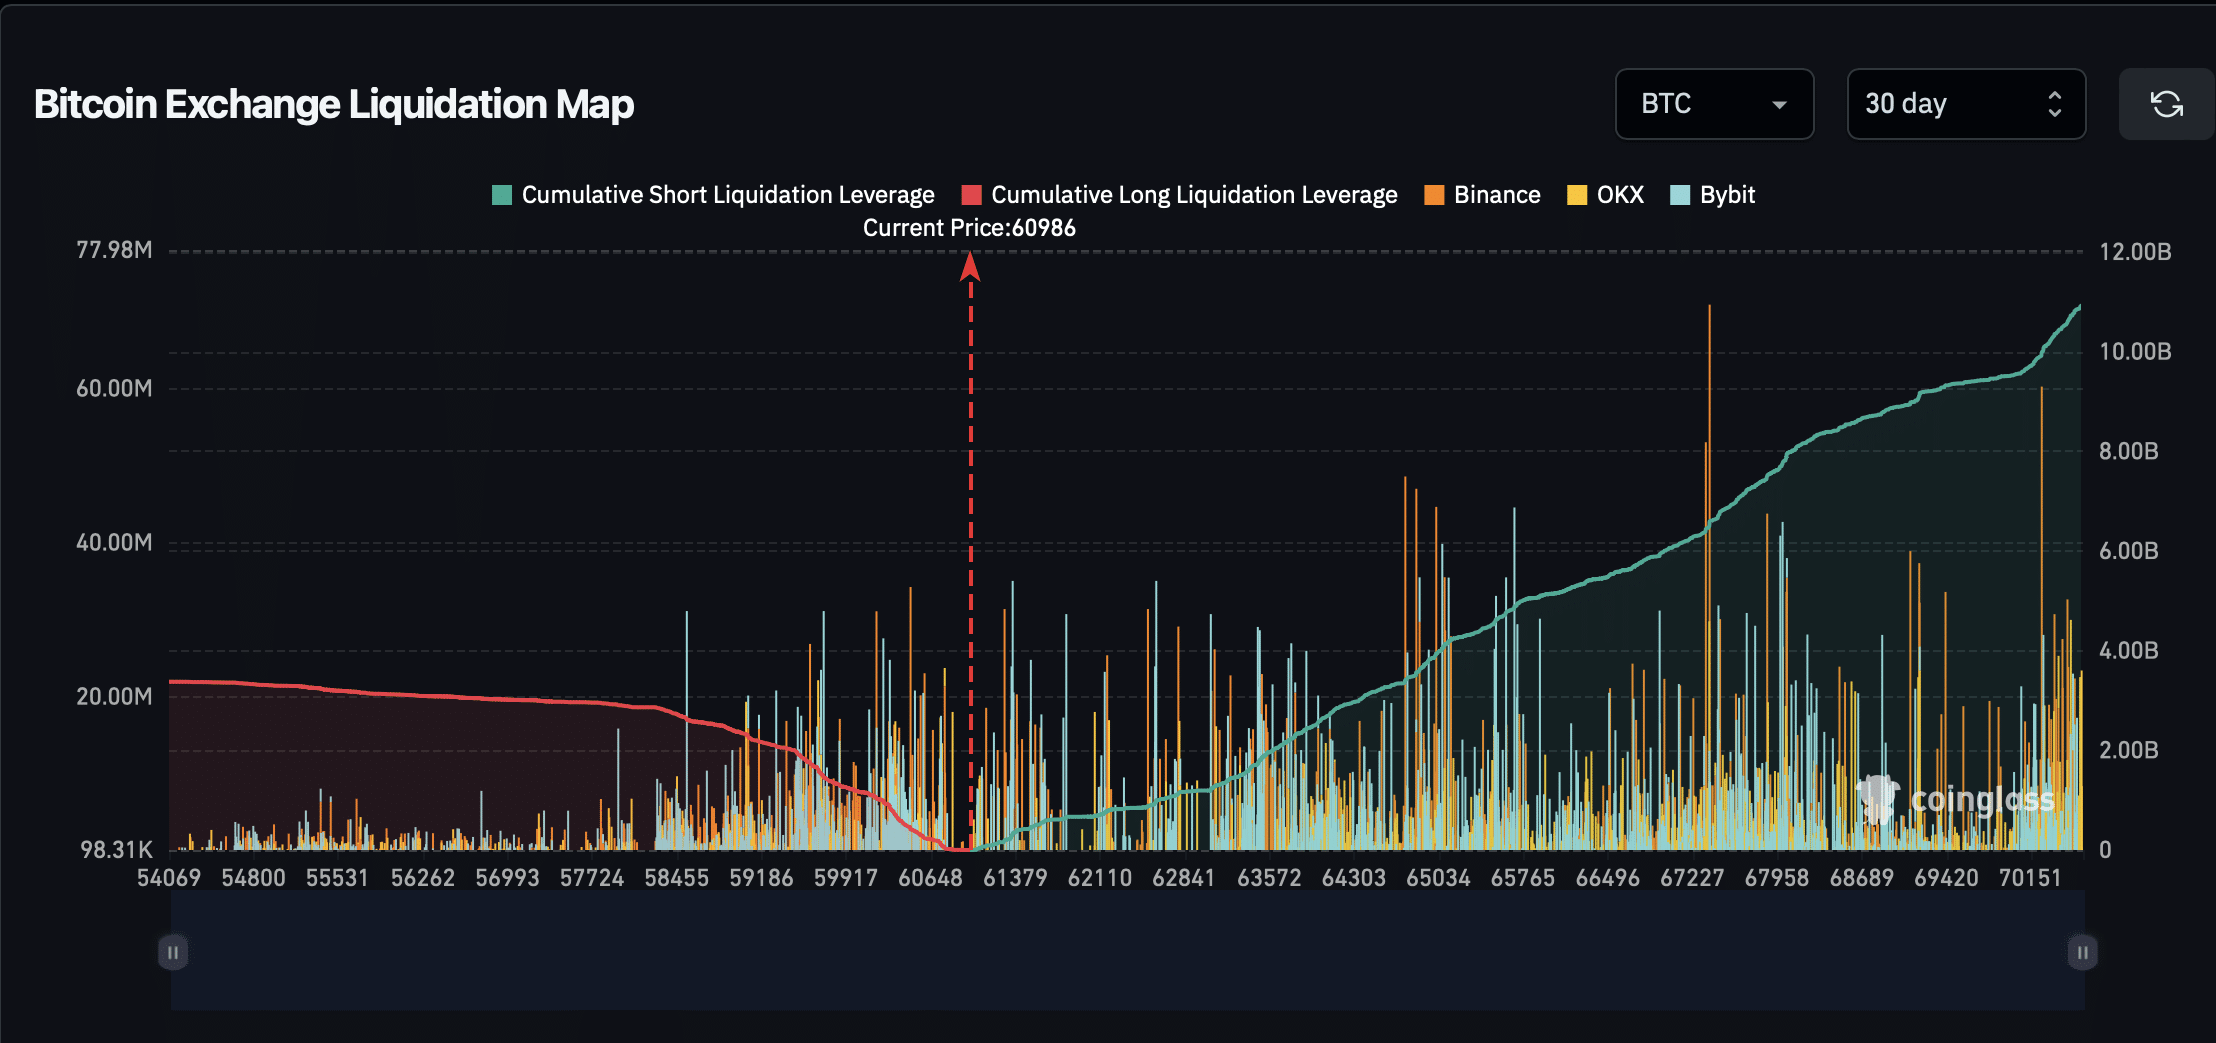
Analyzing BTC’s short and long liquidation leverage on Coinglass, data revealed that the majority of liquidations over the past 30 days have been long positions, suggesting that many traders anticipate a rise in Bitcoin’s value.
Whether these long positions will prove profitable for the traders or if Bitcoin’s price will continue to decline, affirming Edwards’ perspective, only time can tell.
Read Bitcoin’s [BTC] Price Prediction 2024-25
Meanwhile, in terms of where the price is headed, AMBCrypto’s recent report has hinted at a positive shift in miner activity.
Specifically, there has been a notable increase in miners’ reserves, which could potentially bolster Bitcoin’s price.


