- BTC miners have sent fewer coins to exchanges over the past few weeks
- According to a CryptoQuant analyst, they may be waiting for the coin’s price to rally to sell at a profit
Bitcoin’s [BTC] miner-to-exchange activity has declined over the past few weeks, despite the spike in the amount of coins held in miners’ wallets on the network. This was one of the findings of pseudonymous CryptoQuant analyst The Kriptolik.
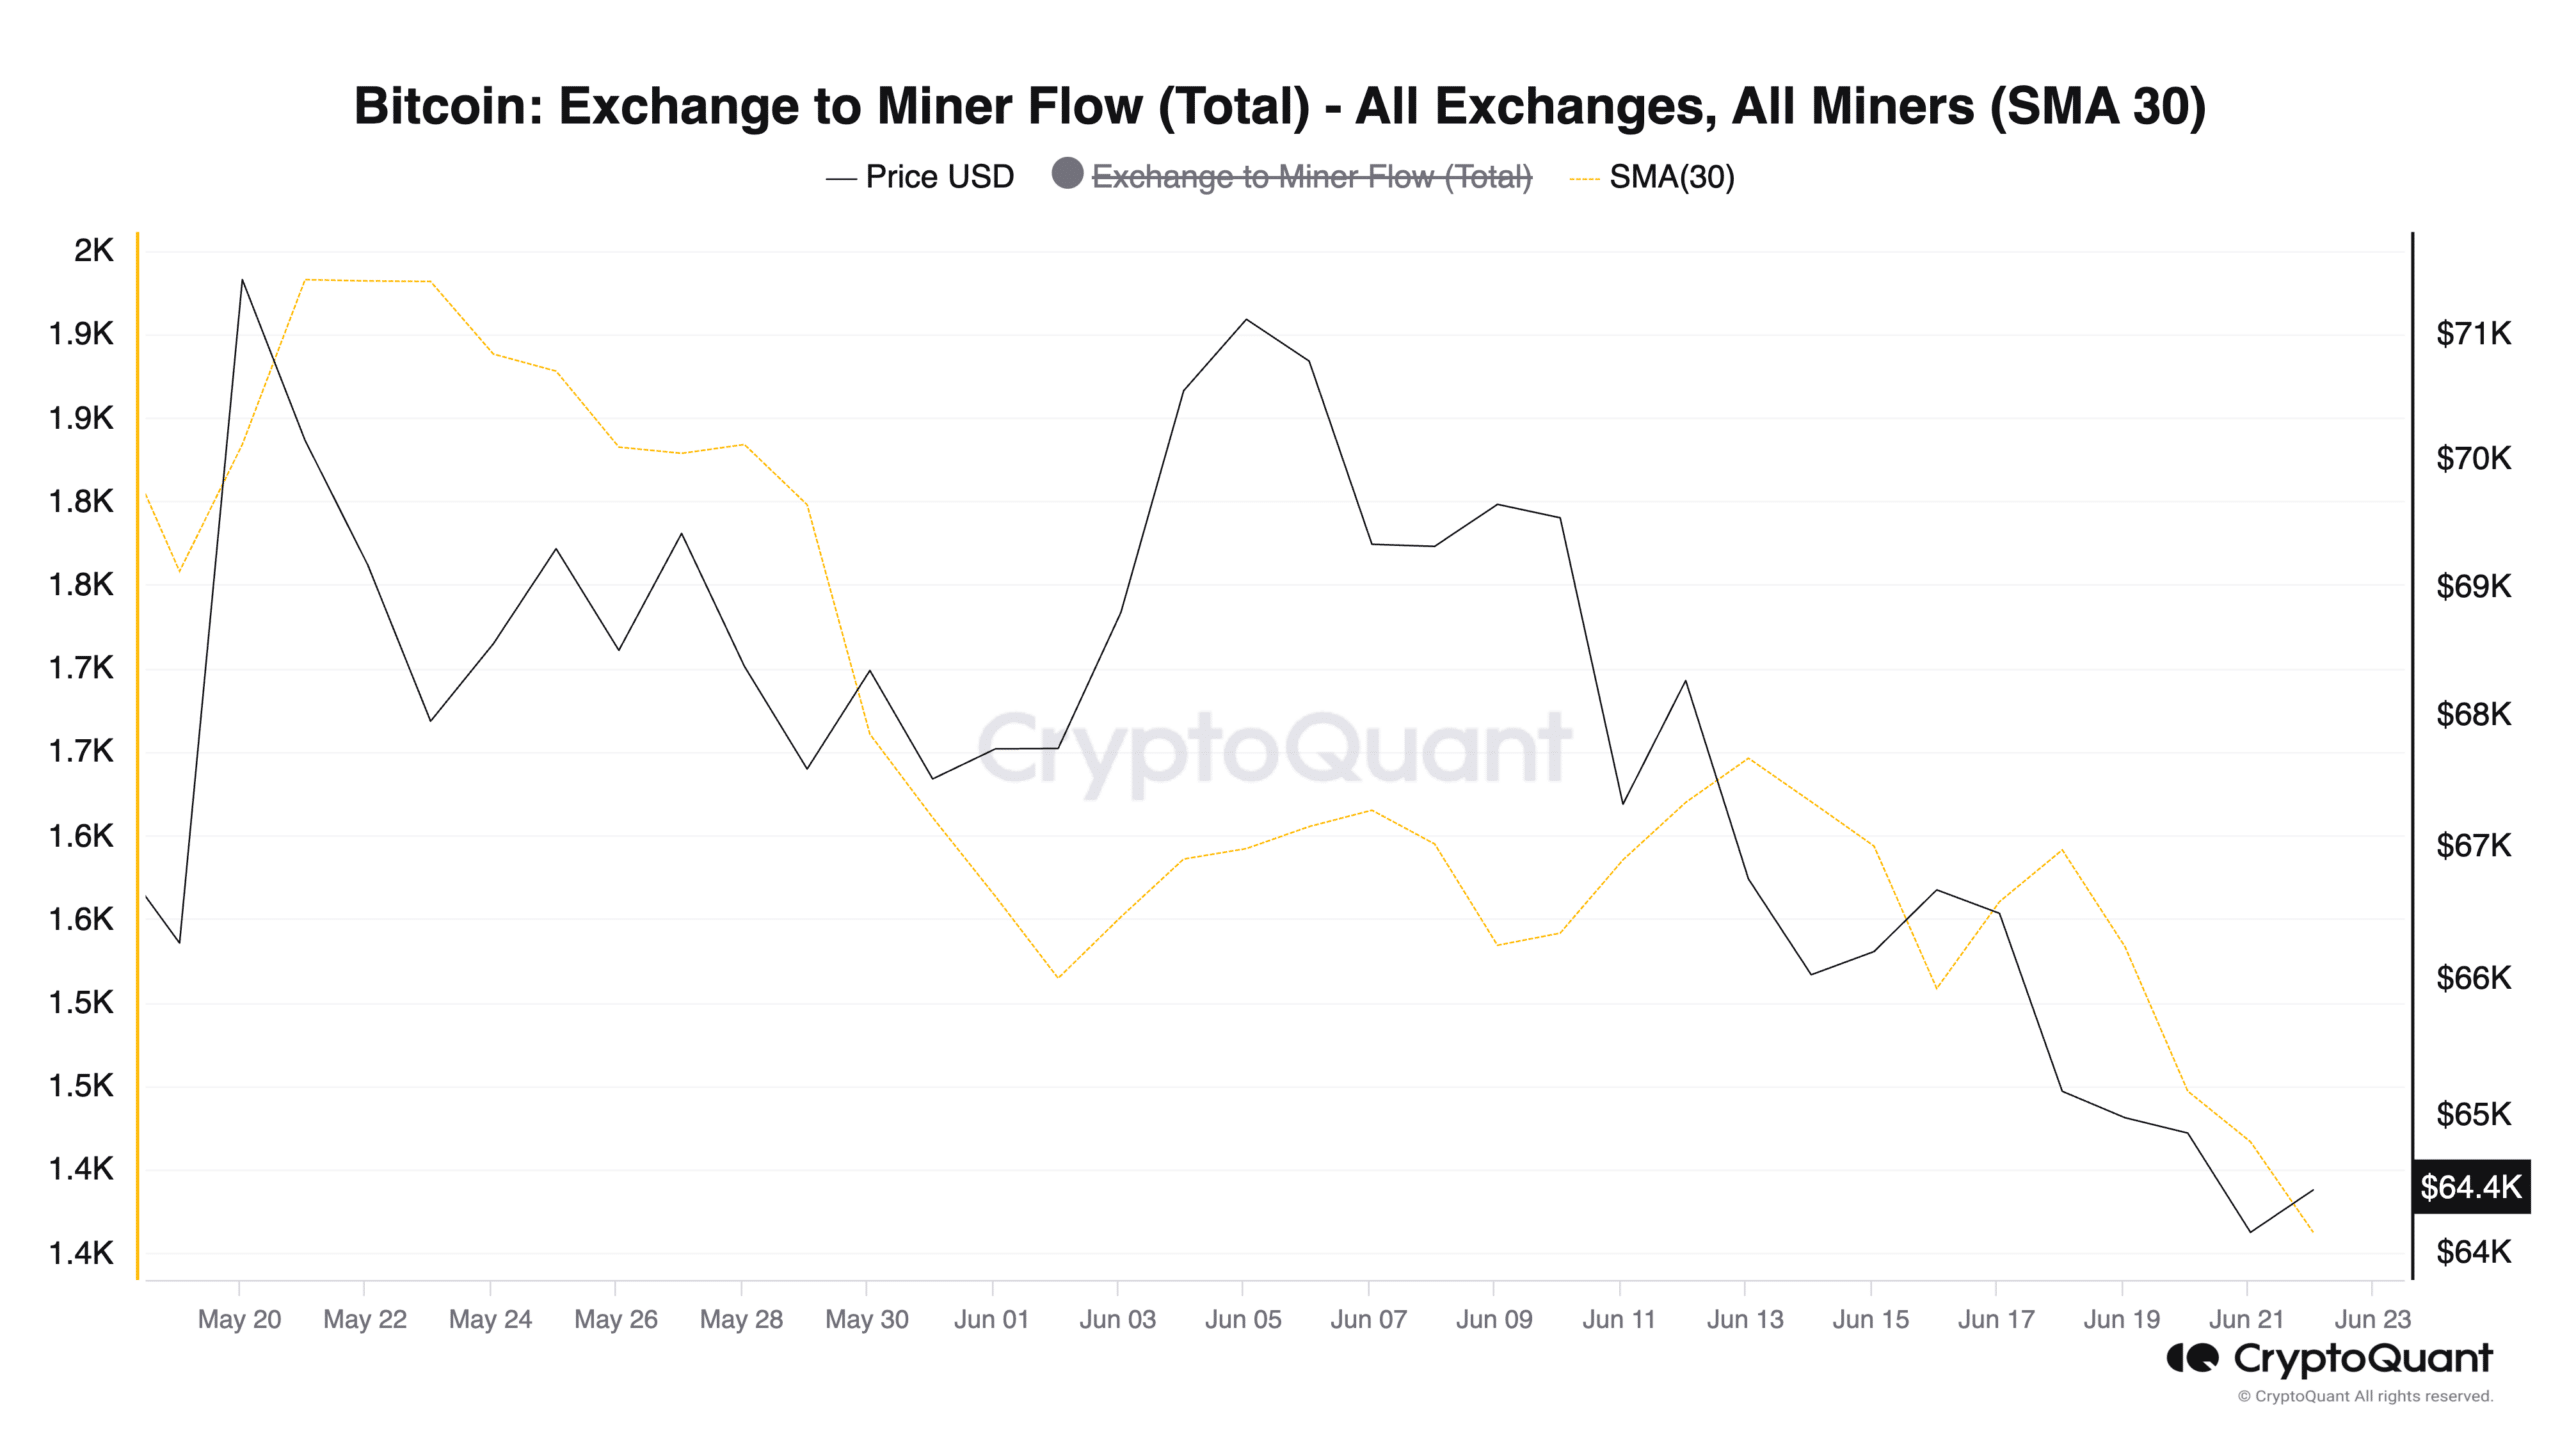
According to the analyst, BTC miner reserves have climbed to a two-week high too. This represents the amount of coins held in affiliated miners’ wallets. Its value indicates the reserves that miners are yet to sell. At the time of writing, these had a value $117 billion at prevailing market prices.
BTC’s ongoing poor price performance has led to a trend of miners refraining from offloading a significant amount of their coin holdings on exchanges. Kriptolik also noted,
“Despite miner reserves reaching the highest level in the last two weeks, miners are not sending significant amounts of BTC to exchanges to sell, instead opting to accumulate due to the decline in BTC price.”
Assessed using a 30-day moving average, the BTC Miner to Exchange Flow has declined by 11% since the beginning of June. This metric tracks the amount of BTC that miners are transferring from their mining wallets to cryptocurrency exchanges for onward sales.
This trend suggests that BTC miners may be waiting for a price surge, after which they will send their coin holdings to exchanges for profit. In fact, the analyst went on to say,
“This indicates that there could be selling pressure from miners during a future Bitcoin uptrend.”
BTC at risk of further decline
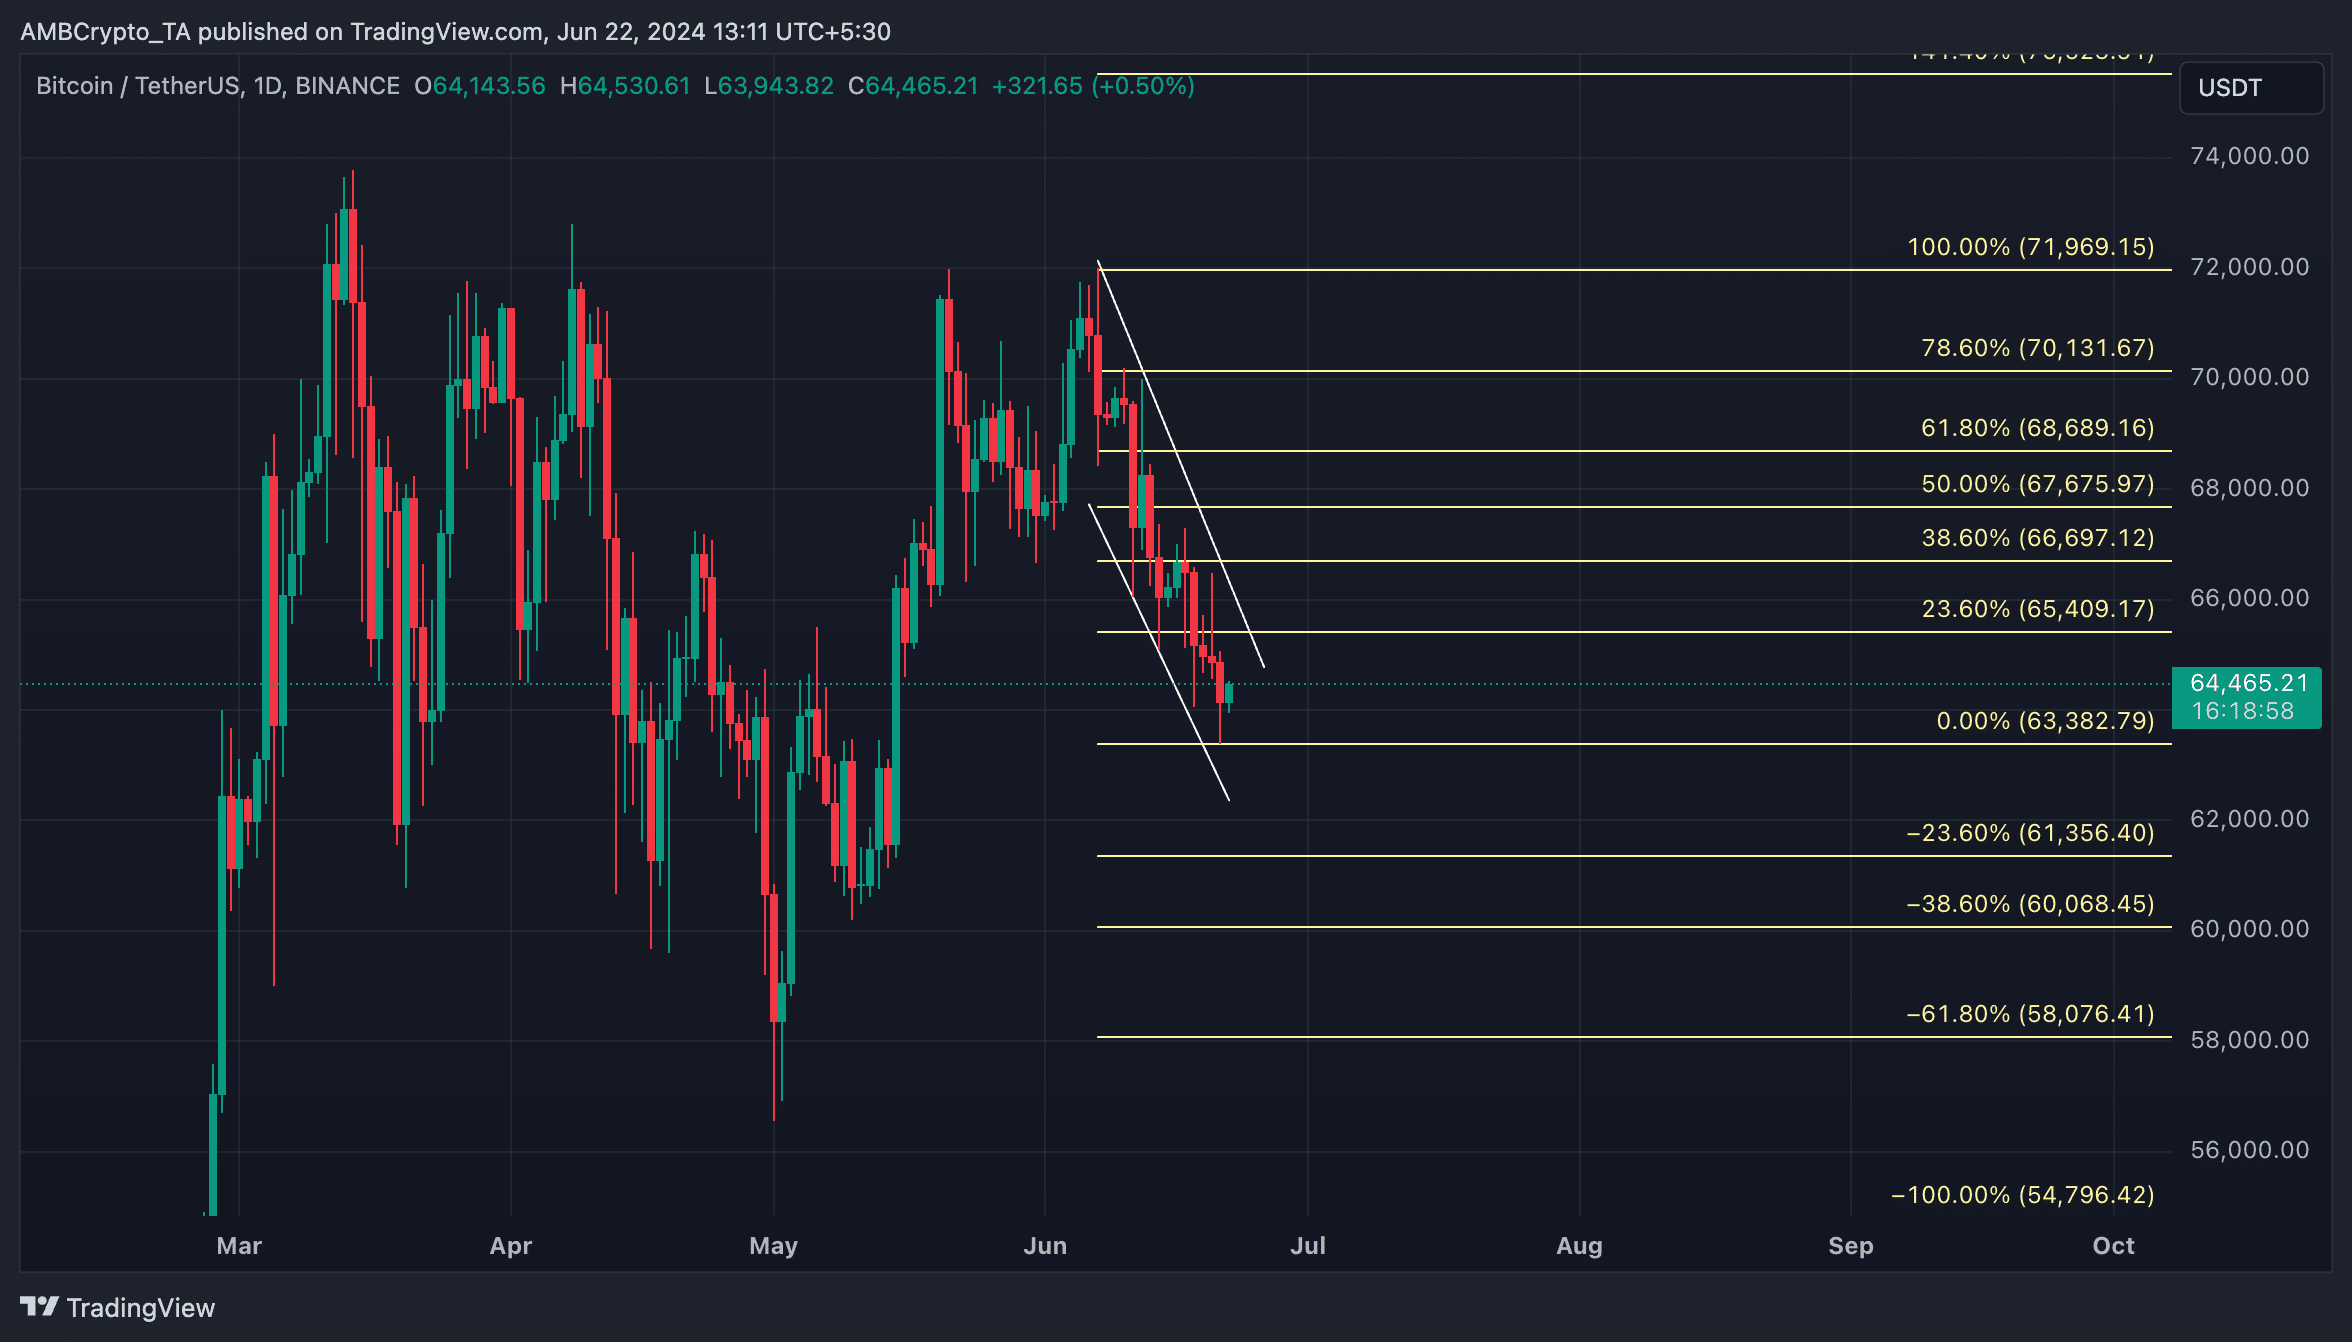
At press time, BTC was valued at $64,403. On a downtrend since 7 June, the king coin’s price has trended within a descending channel on the charts.
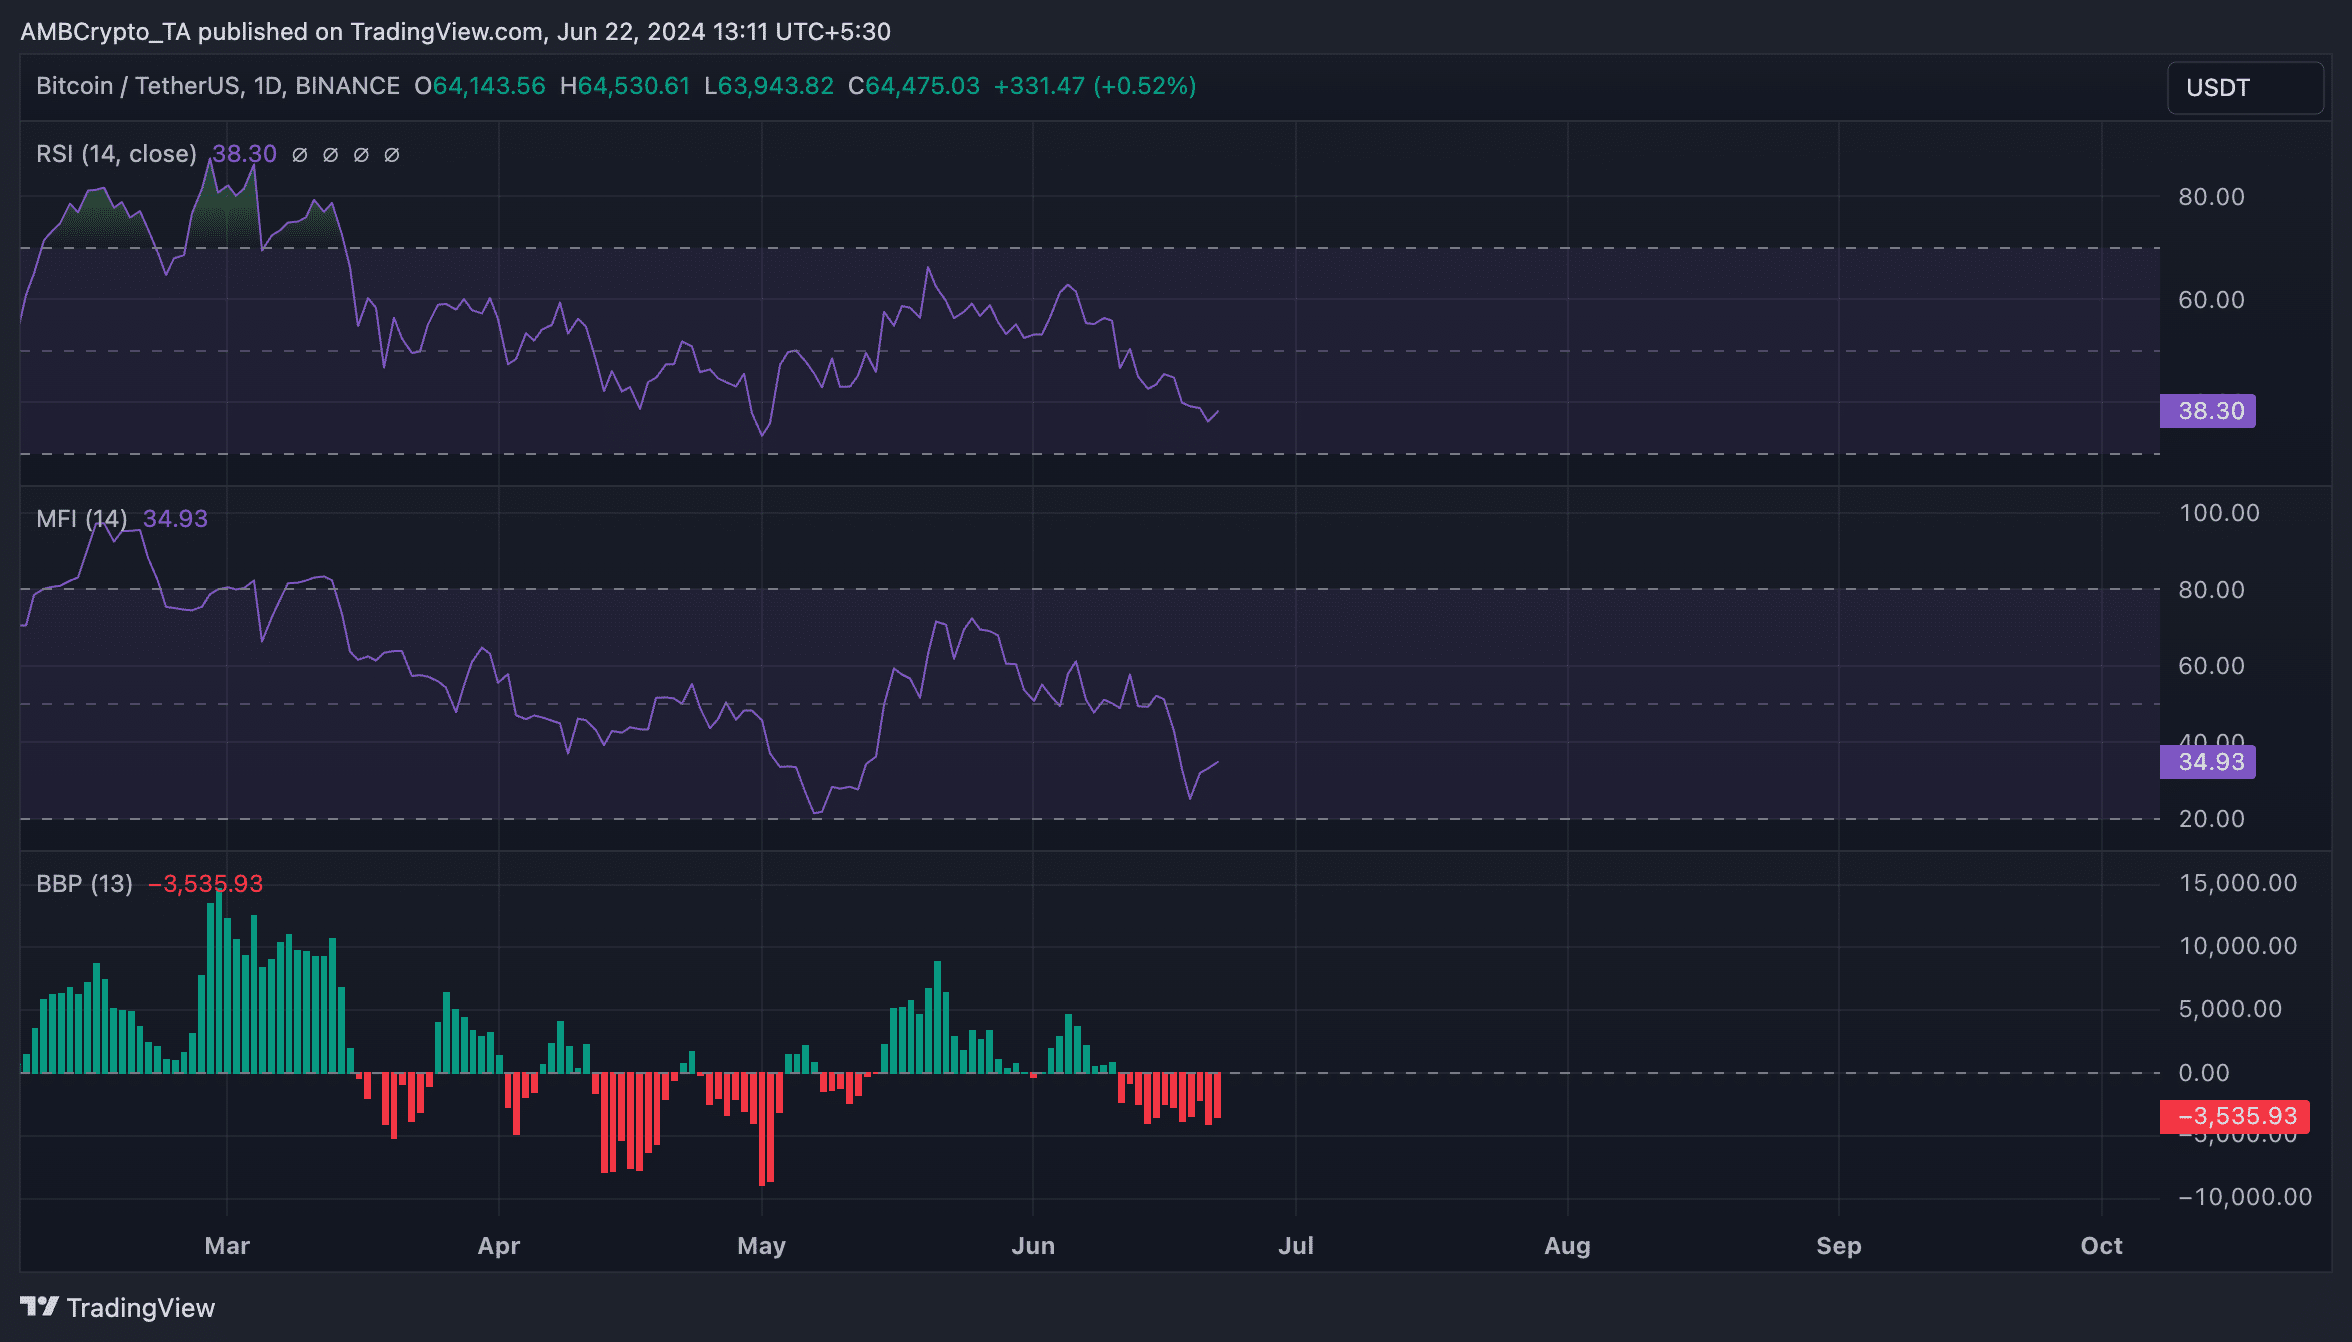
Its key momentum indicators were positioned below their respective center lines at press time. BTC’s Relative Strength Index (RSI) was 37.81, while its Money Flow Index (MFI) was 34.89.
Is your portfolio green? Check the Bitcoin Profit Calculator
At these values, these indicators revealed that BTC distribution outweighed accumulation among market participants.
Confirming the bearish bias towards the leading asset, BTC’s Elder-Ray Index returned a negative value at press time. In fact, its value has been negative since the downtrend began on 7 June.
This indicator measures the relationship between the strength of buyers and sellers in the market. When its value is negative, bear power dominates the market.
If the downtrend intensifies on the charts, BTC’s price might plunge to $63,382.


