Britons looking to sell their properties have been told the best and worst performing areas across the country when it comes to sale price.
According to Nationwide’s latest House Price Index, East Anglia is the weakest performing UK area in terms of house price growth.
“Our regional house price indices are produced quarterly, with data for Q2 (the three months to June) showing a mixed picture, with some regions seeing a modest pick up in growth, but others still recording annual price declines,” said Nationwide’s chief economist Robert Gardner.
According to new data, East Anglia was the “weakest performing region”, with prices down 1.8 per cent year-on-year. East Anglia comprises Norfolk, Suffolk and Cambridgeshire, with Essex also included in some definitions.
Norfolk is one of the counties in East Anglia
GETTY IMAGES
This means that Britons with properties to sell in this area might want to wait a little before putting their homes on the market.
In contrast, “Northern Ireland remained the best performing area, with prices up 4.1 per cent compared with Q2 2023”.
Across England overall, prices were up 0.6 per cent compared with the same period last year. Wales and Scotland both saw a 1.4 per cent year-on-year rise.
In terms of house price growth, there was a large disparity in the north and south of England, according to the latest data.
The economist said: “Northern England (comprising North, North West, Yorkshire and The Humber, East Midlands and West Midlands), continued to outperform southern England.”
Prices went up 2.4 per cent year-on-year in northern England, whereas southern England (comprising South West, Outer South East, Outer Metropolitan, London and East Anglia) saw a 0.3 per cent year-on-year fall. This remained the same as last quarter.
In Southern England, London remained the best-performing region, with an annual price growth maintained at 1.6 per cent – good news for Britons selling in the capital.
Overall, UK house prices were up by 1.5 per cent in June compared with a year ago, which is good news for sellers.
House price growth across the UK year-on-year
- Northern Ireland: Up 4.1 per cent
- Northern England: Up 2.4 per cent
- London: Up 1.6 per cent
- Wales: Up 1.4 per cent
- Scotland: Up 1.4 per cent
- England: Up 0.6 per cent
- Southern England: Down 0.3 per cent
- East Anglia: Down 1.8 per cent
As for month-on-month changes, the expert commented: “UK house prices edged up by 0.2 per cent in June, after taking account of seasonal effects.
“This resulted in the annual rate of growth rising from 1.3 per cent in May to 1.5 per cent in June, leaving prices around three per cent below the all-time high recorded in the summer of 2022.”
LATEST DEVELOPMENTS

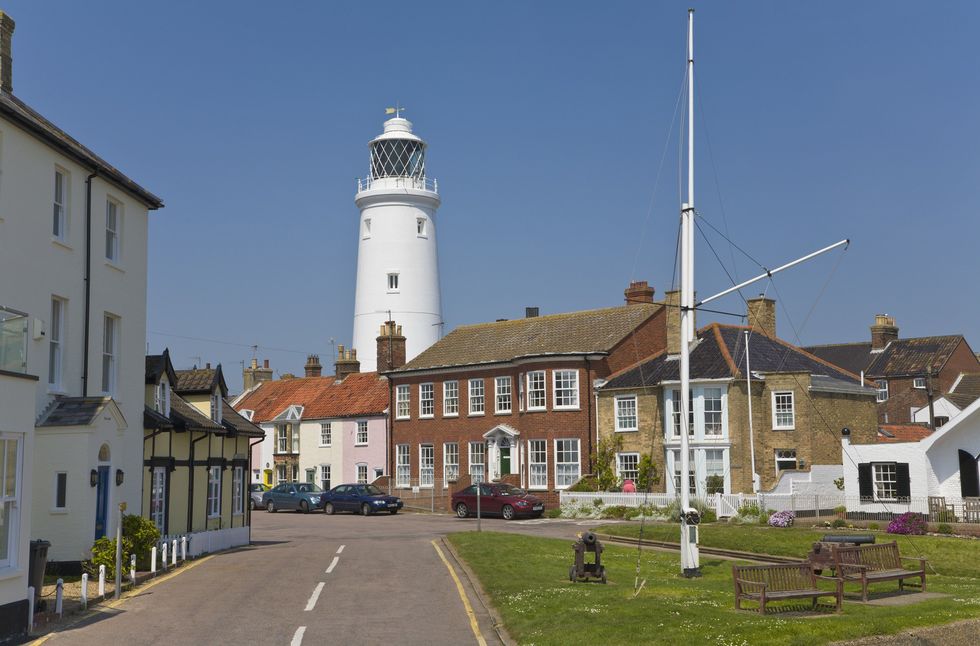
Suffolk is another county in East Anglia
GETTY IMAGES
This comes as Britons were told the UK cities where house prices have seen the biggest annual increase – plus where you’ll get more for your money.
According to new data, the highest annual percentage change in house price was in Belfast, increasing by 3.4 per cent.
In contrast, the lowest annual percentage change in house price was in Bournemouth, dropping by 1.5 per cent.

