- Ethereum’s price dropped by over 2% in the last seven days.
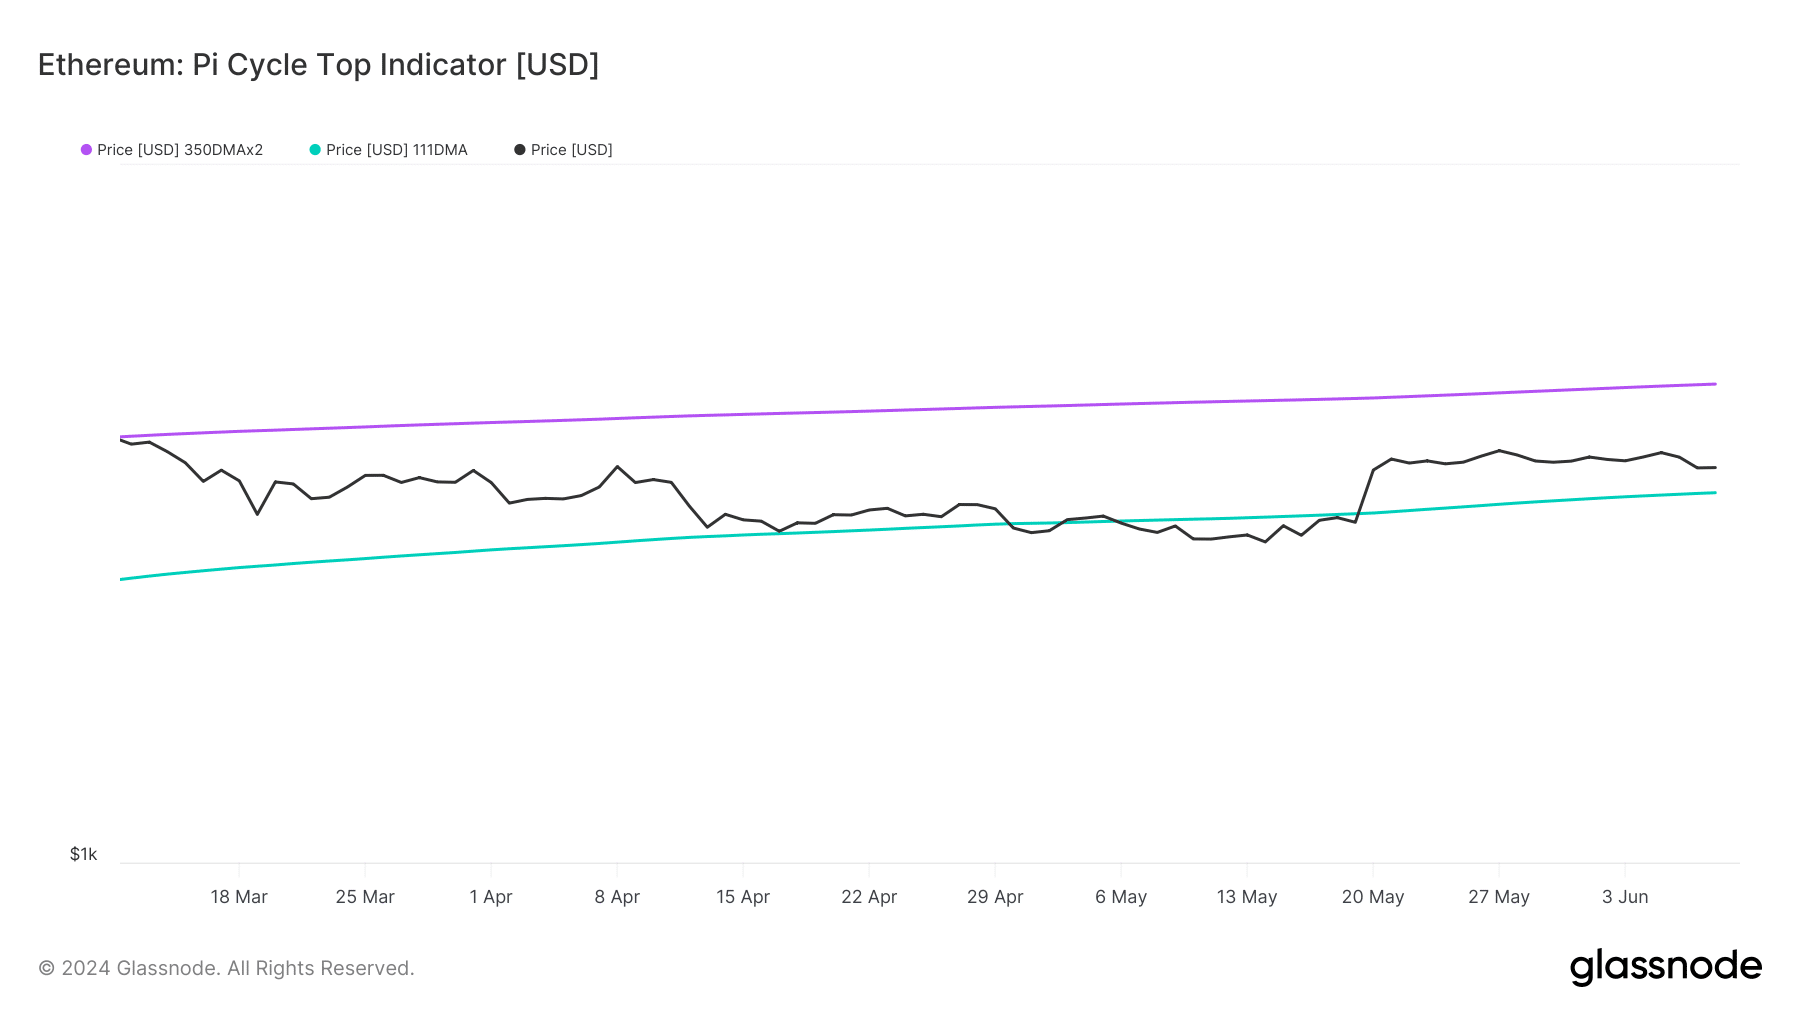
- A metric suggested that ETH’s price was near its market bottom.
Ethereum [ETH] bears dominated the last week as the token’s price dropped. However, this might be the last chance for investors to accumulate more ETH while its price is low.
ETH was at a crucial resistance level, and a breakout above it could result in a massive rally in the coming weeks or months.
Should you buy ETH now?
CoinMarketCap’s data revealed that Ethereum witnessed a price correction last week as its value dropped by more than 2%.
At the time of writing, ETH was trading at $3,687.02 with a market capitalization of over $442 billion. However, this bearish price trend might change soon as ETH is testing a key resistance level.
Milkybull, a popular crypto analyst, recently posted a tweet revealing this development. A breakout above the resistance would spark a massive bull rally.
Therefore, this might actually be the last chance for investors to buy ETH under $3.7k in this cycle.
AMBCrypto then checked ETH’s on-chain data to see whether investors utilized this opportunity to accumulate.
As per our analysis of CryptoQuant’s data, ETH’s net deposit on exchanges was low compared to the last seven days’ average, reflecting high buying pressure. However, the other datasets suggested otherwise.
For example, ETH’s Coinbase Premium was red. This clearly meant that selling sentiment was dominant among U.S. investors.
Odds of a bull rally
AMBCrypto then took a closer look at Ethereum’s current state to better understand whether a price increase is possible in the near term.
AMBCrypto’s look at Glassnode’s data revealed that ETH’s price was near its market bottom, as per the Pi cycler top indicator.
This meant that the chances of ETH gaining bullish momentum in the coming days are high. If that happens, then ETH might soon touch $4.8k, which is optimistic to look at.
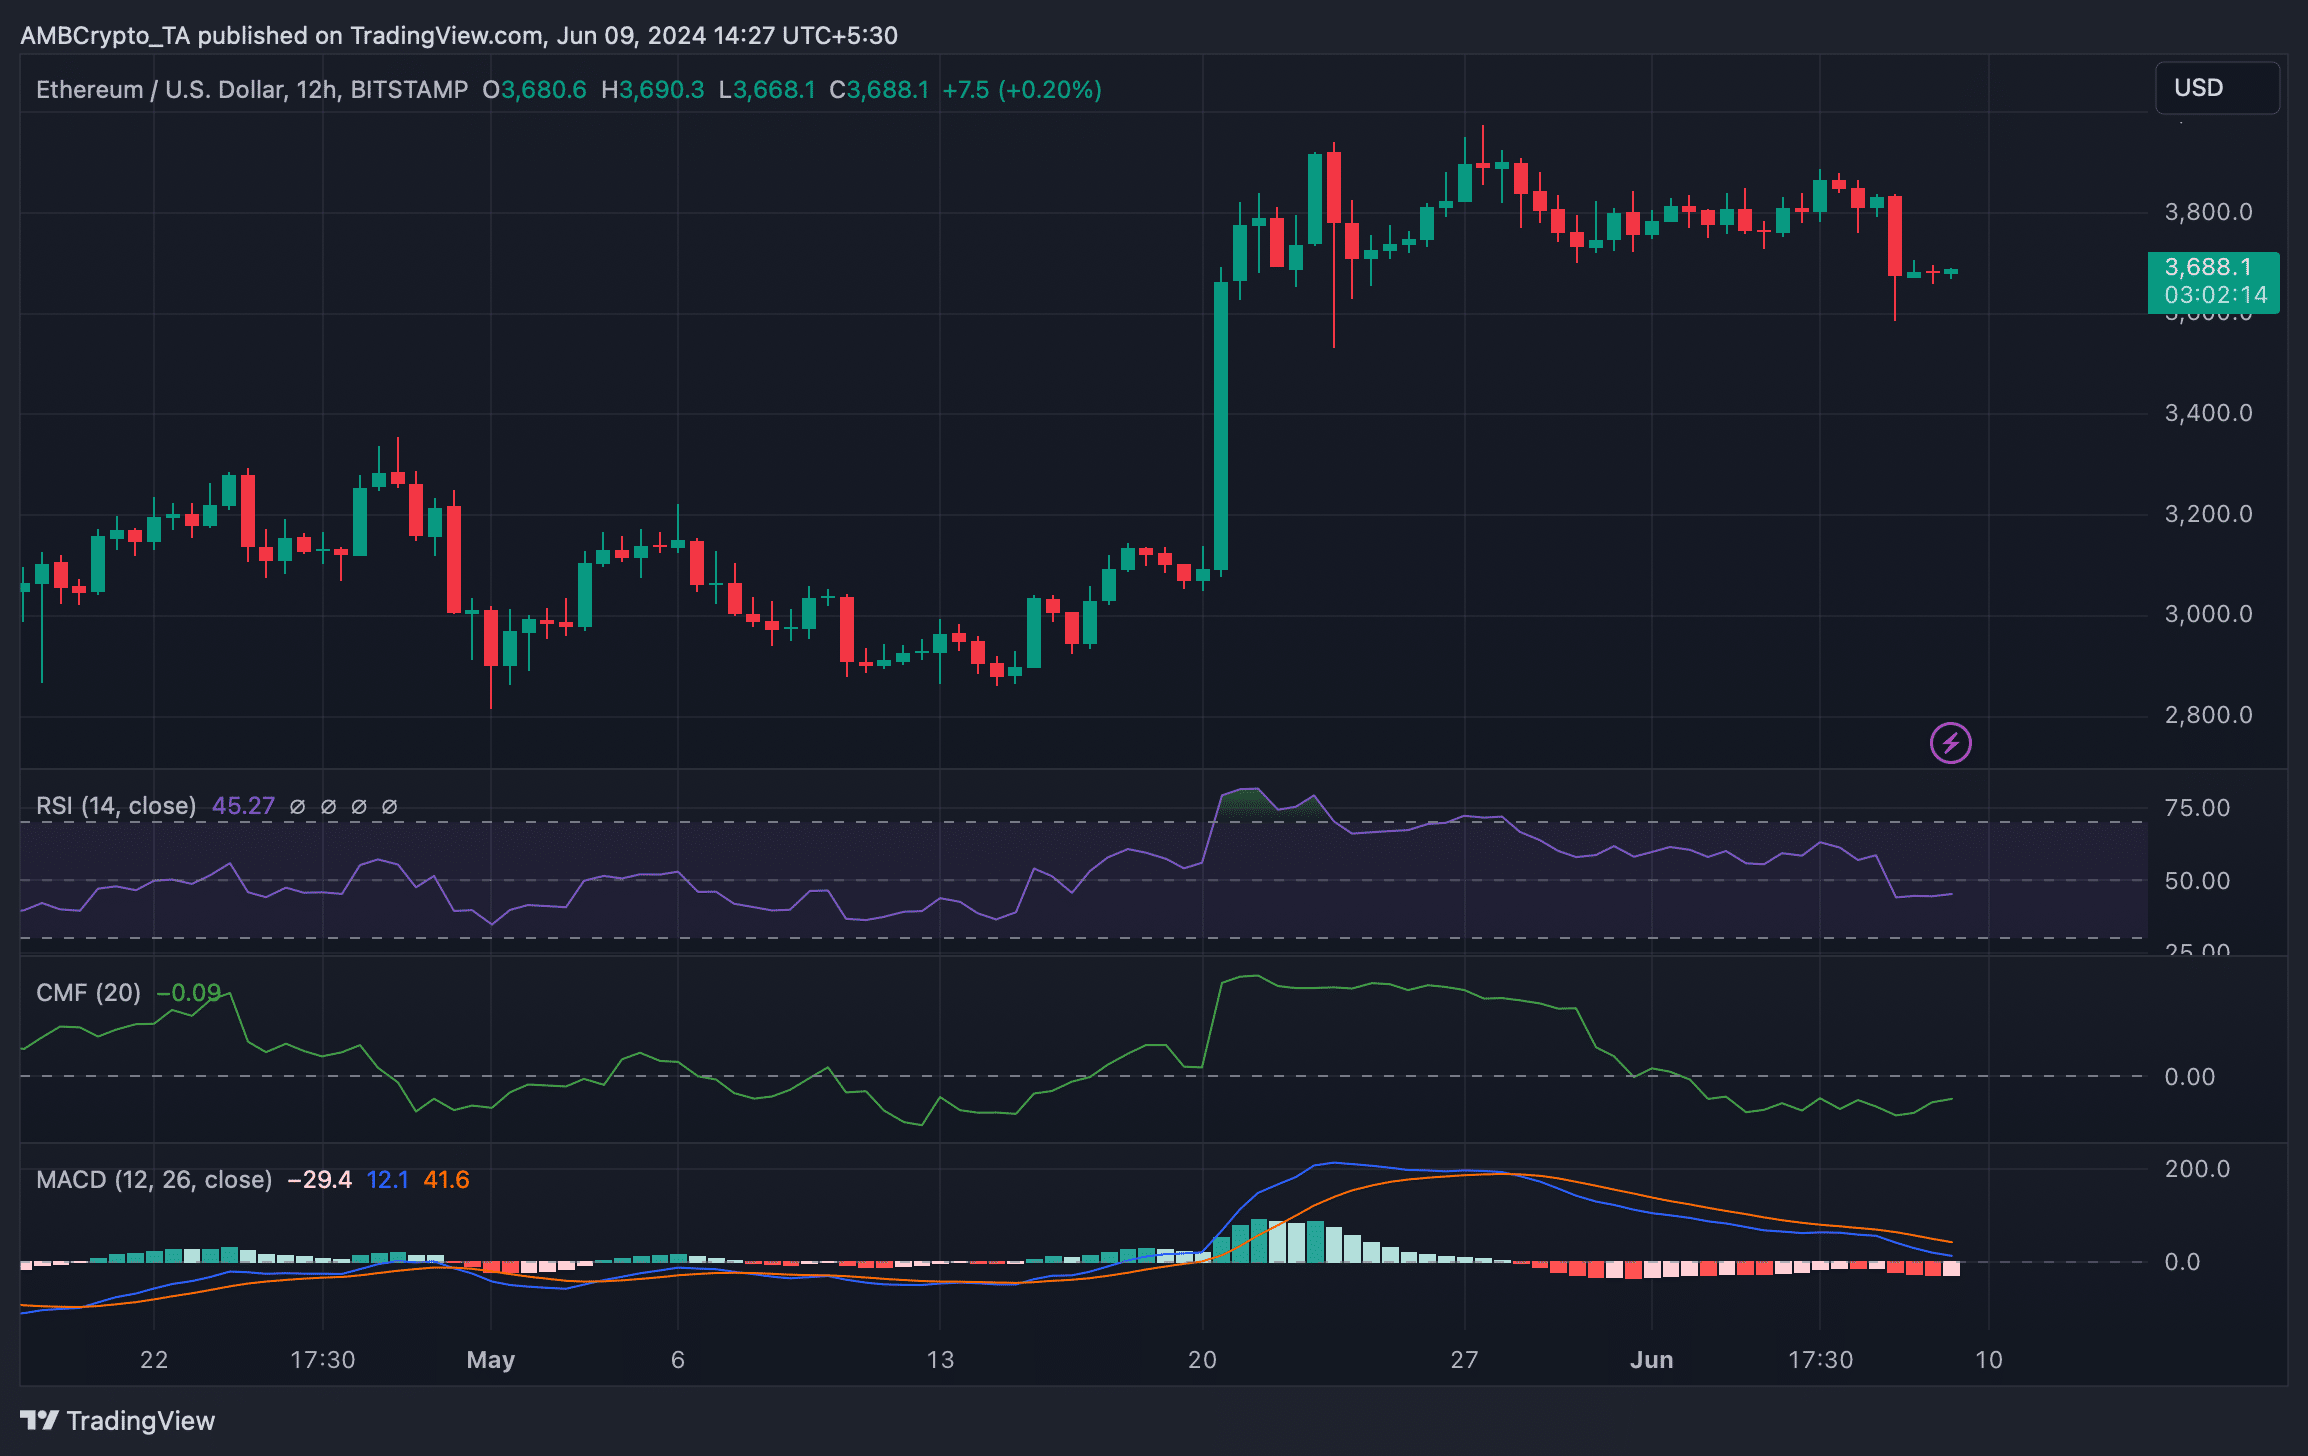
We then took a look at the token’s 12-hour chart to see what market indicators suggested regarding a price uptick in the short term.
As per our analysis, the MACD looked in the sellers’ favor as it displayed a bearish crossover.
Read Ethereum’s [ETH] Price Prediction 2024-25
Its Relative Strength Index (RSI) also remained bearish as it was under its neutral mark. These indicators hinted at a continued price decline.
Nonetheless, the Chaikin Money Flow (CMF) turned bullish by moving northwards towards the neutral mark in the last few days.


