- Bitcoin has a bullish market structure on the daily timeframe.
- The significant capital inflow and strong momentum favored an upward move on the daily chart.
Bitcoin [BTC] saw increased demand from ETFs a month after the halving event. An AMBCrypto report noted that the altcoin performance has eclipsed Bitcoin recently.
Another AMBCrypto analysis drew parallels between the 2020 post-halving and current trends. The Rainbow Chart showed that BTC was still in the buy zone – does the Bitcoin price prediction agree?
Bitcoin bulls are not willing to force the issue yet
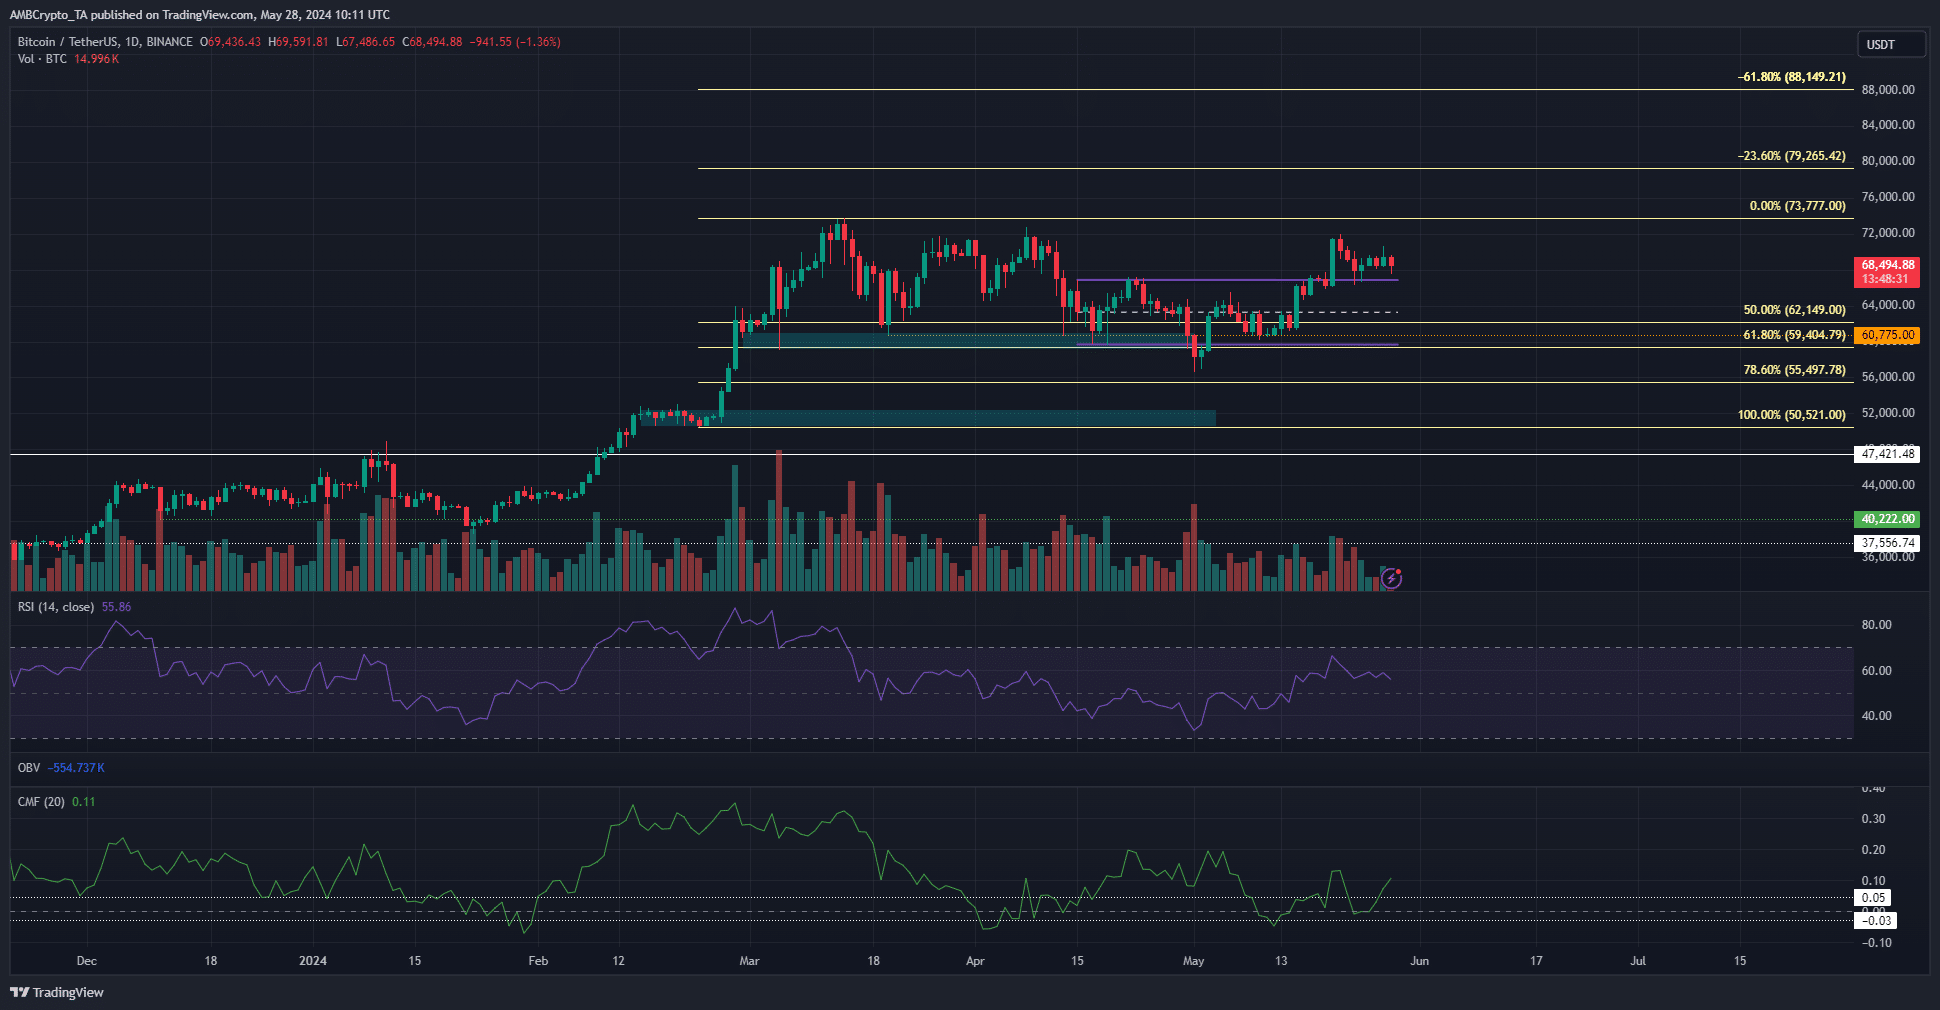
The price action on the 1-day chart was bullish. Bitcoin dropped below the 61.8% Fibonacci retracement level (pale yellow) at $59.4k in early May but was quick to recover.
It has flipped the short-term range (purple) high at $67k to support. Moreover, the CMF showed a reading of +0.12 to reflect significant capital inflow to the market.
The RSI on the daily chart was also above neutral 50 to signal bullish momentum. Together, the technical indicators pointed toward a bullish Bitcoin price prediction.
This indicated a lower timeframe liquidity hunt and outlined a consolidation phase. The higher timeframe uptrend will likely continue soon. The Fibonacci extension levels at $79.2k and $88.1k would be the target for buyers in the coming weeks.
Does the liquidation cluster to the south warrant Bitcoin’s attention?


Source: Hyblock
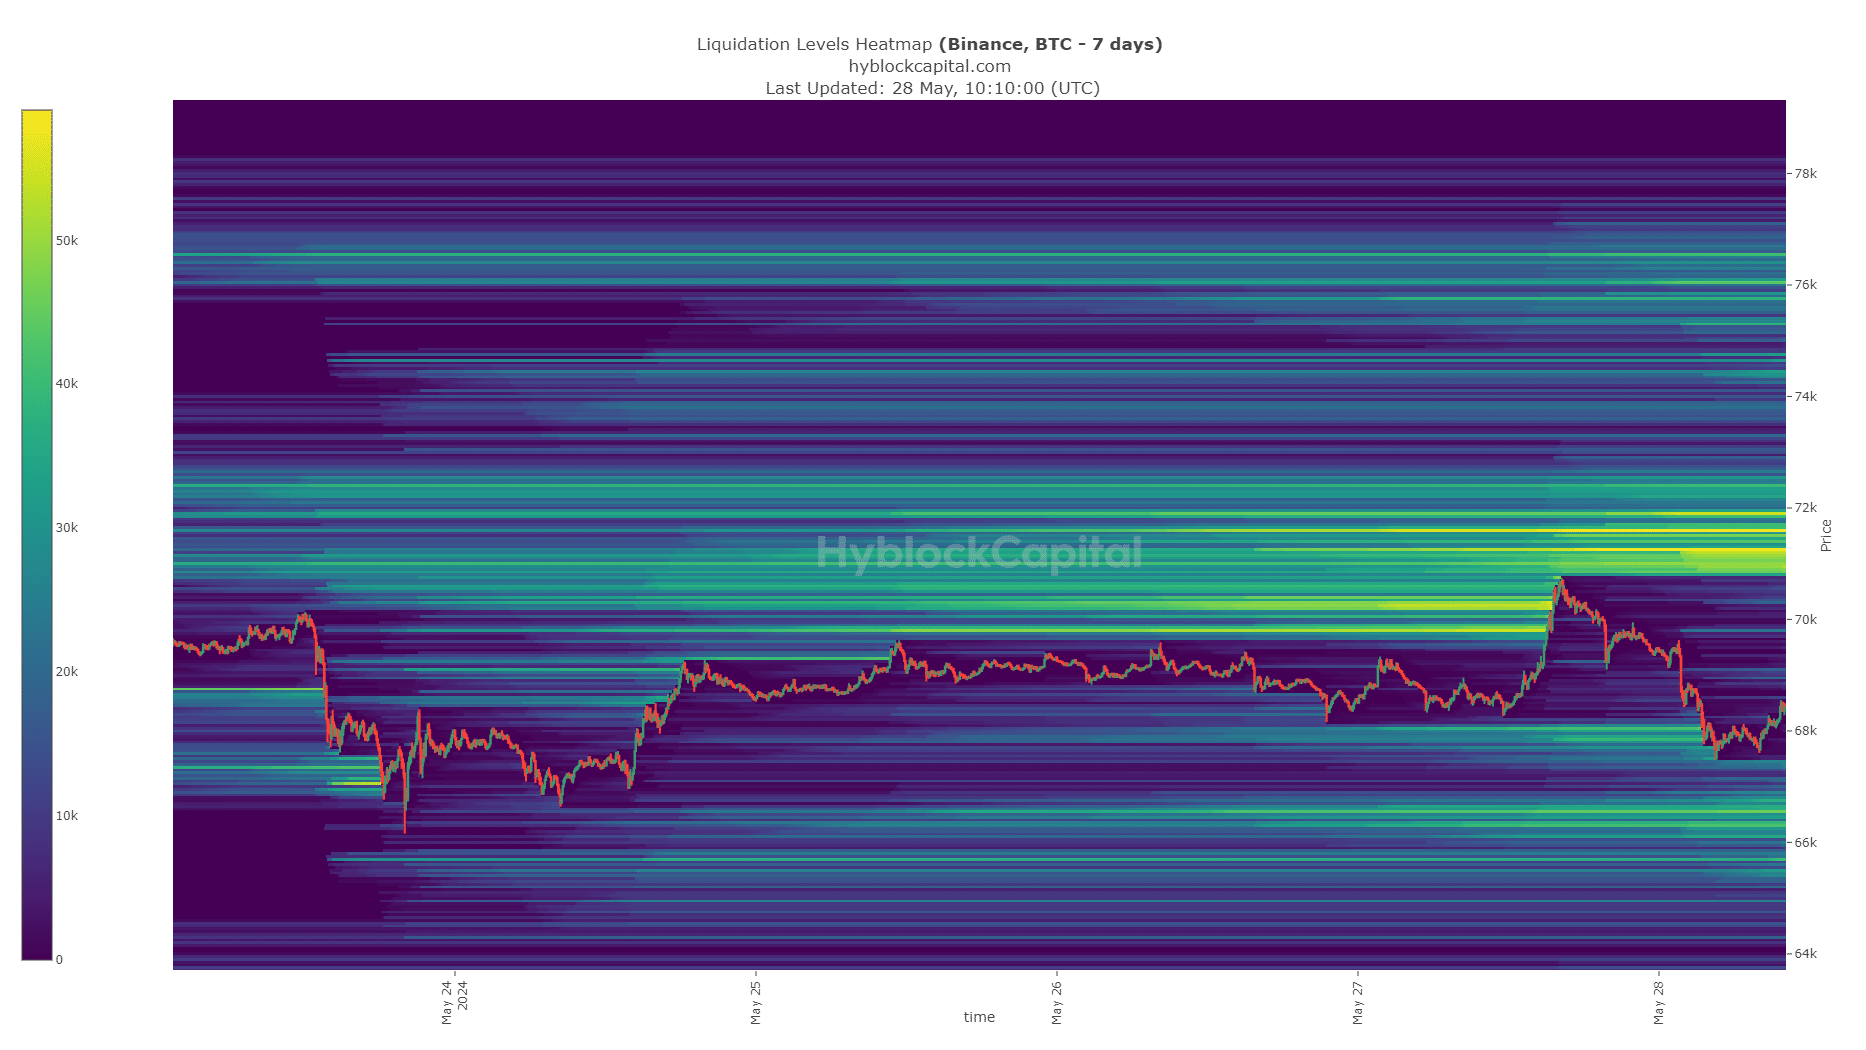
The data from Hyblock showed that the $66.2k-$66.7k region was home to a cluster of liquidation levels, and BTC might dip to this region.
Read Bitcoin’s [BTC] Price Prediction 2024-25
Alternatively, the liquidity at $67.8k, which has already been swept, might be enough to propel Bitcoin back to the $71.2k resistance zone.
Traders need to be prepared for both outcomes and manage their risk accordingly. Short-term volatility was possible and a revisit of the $66.5k level would provide a buying opportunity.
Disclaimer: The information presented does not constitute financial, investment, trading, or other types of advice and is solely the writer’s opinion.


